3.1.2. Developing a simple plugin for plotting data from IDSs
Note
Before proceeding with the plugin development instructions make sure that you have cloned IMASViz GIT repository (for more information see section Running IMASViz from source)!
This section will cover step by step instructions on how to:
write a very simple introductory plugin example (~80 lines of code),
how to register the plugin in IMASViz, and
how to run the plugin in IMASViz.
This simple plugin can be considered also as a starting template for more complex plugins with advanced design and functionalities.
The main basic steps which will be covered in this tutorial are as follows:
Adding IMASViz home directory to
$PYTHONPATHSetting plugin source structure
Writing the code:
Import statements
Class (prescribed name)
Class inheritance
Mandatory method functions
Registering plugin in IMASViz
Note
Complete code of the simple plugin (named as simplePlotPluginExample) is
available in IMASViz code source in
$VIZ_HOME/imasviz/VizPlugins/viz_simple_plot_example.
3.1.2.1. Adding IMASViz sources to $PYTHONPATH
In order to have IMASViz sources at our disposal the $VIZ_HOME must be added
to $PYTHONPATH environment variable. This can be achieved by running
the next command in the terminal:
# bash
export PYTHONPATH=${VIZ_HOME}:${PYTHONPATH}
# tcsh
setenv PYTHONPATH ${VIZ_HOME}:${PYTHONPATH}
3.1.2.2. Setting plugin source structure
All plugin source files must be stored in a separate directory under
$VIZ_HOME/imasviz/VizPlugins/<folder_name>. The name of the directory
should start with “viz_”.
For the purposes of this tutorial create a new directory with label
viz_my_example to distinguish it from other plugins. The full path is then
$VIZ_HOME/imasviz/VizPlugins/viz_my_plugin.
Inside the newly created directory create a new Python script file. In this case
name it as myPlugin.py. The script can be left empty for now.
3.1.2.3. Python code
This subsection will cover the contents of the plugin main Python script file
$VIZ_HOME/imasviz/VizPlugins/viz_my_plugin/myPlugin.py (previously
created in Setting plugin source structure).
3.1.2.3.1. Required import statements
As the first entry in the Python script, the next modules need to be imported with the use of the import statements.
In your myPlugin.py file add:
# modules for event logging system and for operating system dependent
# functionality
import logging, os
# IMASViz plugin sources
from imasviz.VizPlugins.VizPlugin import VizPlugin
# Matplotlib library
import matplotlib.pyplot as plt
3.1.2.3.2. Prescribed class name
The plugins main Python file must contain a class with the same name as the name of the Python file. In this case, a class myPlugin.
In your myPlugin.py file add:
class myPlugin():
3.1.2.3.3. Inheritance
The class must inherit from VizPlugin class from the VizPlugin.py.
This is required for IMASViz to be able to gather necessary information
required for properly running the plugin.
In your myPlugin.py file add:
class myPlugin(VizPlugin):
3.1.2.3.4. Mandatory method functions
The plugin class must contain 5 mandatory method functions (besides constructor):
execute(self, vizAPI, pluginEntry)
getEntries(self)
getPluginsConfiguration(self)
getAllEntries(self)
isEnabled(self)
3.1.2.3.4.1. Constructor
In this case, leave the constructor empty.
In your myPlugin.py file add:
def __init__(self):
    pass
3.1.2.3.4.2. execute()
The execute() function consists of three parts:
Obtaining data source from IMASViz
Checking if the IDS data was already fetched
Extracting and plotting the data from the IDS
1. Obtaining data source (IDS object) from IMASViz:
This is done through vizAPI - the IMASViz Application Program Interface (API) and its GetDataSource function.
In your myPlugin.py file add:
# Get dataSource from the VizAPI (IMASViz Application Program Interface)
# Note: instance of "self.datatreeView" is provided by the VizPlugins
# through inheritance
dataSource = vizAPI.GetDataSource(self.dataTreeView)
# Get case parameters (shot, run, machine user) from the dataSource
shot = dataSource.shotNumber
run = dataSource.runNumber
machine = dataSource.imasDbName
user = dataSource.userName
occurrence = 0

# Displaying basic case information
print('Reading data...')
print('Shot    =', shot)
print('Run     =', run)
print('User    =', user)
print('Machine =', machine)
2. Checking if the IDS data was already fetched
With the use of functions provided by vizAPI we can be check if the case (IDS) data was already fetched (loaded in memory) while running IMASViz. In case the data was not yet fetched it can be done with the use of the LoadIDSData function (with the use of this function also the IMASViz data tree view browser gets updated automatically).
The IDS object is then obtained with the use of getImasEntry() function for given occurrence (default occurrence value is 0).
In your myPlugin.py file add:
# Check if the IDS data is already loaded in IMASviz. If it is not,
# load it
if not vizAPI.IDSDataAlreadyFetched(self.dataTreeView, 'magnetics', occurrence):
    logging.info('Loading magnetics IDS...')
    vizAPI.LoadIDSData(self.dataTreeView, 'magnetics', occurrence)

# Get IDS object
self.ids = dataSource.getImasEntry(occurrence)
3. Extracting and plotting the data from the IDS
With the IDS object available its contents can be easily accessed (following the structure defined by the Data Dictionary). The data can be then plotted with the use of the Matplotlib Python library (link).
This plugin example will read some simple data from the Magnetics IDS and plot it using Matplotlib plitting utilities:
time values (stored in
magnetics.timenode) -> X axispoloidal field probe values (stored in
magnetics.bpol_probearray of structures (AOS). The values are stored inmagnetics.bpol_probe[i].field.datawhere \(i\) is the array index) -> Y axis
In your myPlugin.py file add:
# Get some data from the IDS and pass it to plot (using matplotlib)
# - Set subplot
fig, ax = plt.subplots()
# - Extract X-axis values (time)
time_values = self.ids.magnetics.time
x = time_values
# - Get the size of AoS (number of arrays)
num_bpol_probe_AoS = len(self.ids.magnetics.bpol_probe)
# - For each array extract array values and create a plot
for i in range(num_bpol_probe_AoS):
    # - Extract array values
    y = self.ids.magnetics.bpol_probe[i].field.data
    # - Set plot (line) defined by X and Y values +
    # - set line as full line (-) and add legend label.
    ax.plot(x, y, '-', label='bpol_probe[' + str(i) + ']')
# - Enable grid
ax.grid()
# - Set axis labels and plot title
ax.set(xlabel='time [s]', ylabel='Poloidal field probe values',
       title='Poloidal field probe')
# - Enable legend
ax.legend()
# - Draw/Show plots
plt.show()
3.1.2.3.4.3. getEntries()
The getEntries() method function provides IMASViz the information to which IDS the plugin is associated. While in the IMASViz tree view browser, the plugin will be then accessible by right-clicking on here defined IDS (the option for running this plugin gets shown in the popup menu).
In this case, as the plugin deals with the data stored in Magnetics IDS,
this option should be set to "magnetics" as shown in the code part below.
In your myPlugin.py file add:
def getEntries(self):
    if self.selectedTreeNode.getIDSName() == "magnetics":
        return [0]
3.1.2.3.4.4. getPluginsConfiguration()
The getPluginsConfiguration() method function provides additional configurations to IMASViz. In this case no additional configurations are required -> the function returns value None.
In your myPlugin.py file add:
def getPluginsConfiguration(self):
    return None
3.1.2.3.4.5. getAllEntries()
The getAllEntries() method function provides IMASViz ‘cosmetic’ information (e.g. label which should be shown in the popup menu etc.).
In your myPlugin.py file add:
def getAllEntries(self):
    # Set a text which will be displayed in the pop-up menu
    return [(0, 'My plugin...')]
3.1.2.3.4.6. isEnabled()
Through the isEnabled() method function the custom plugin can be
either enabled (returns True) or disabled (returns False).
In your myPlugin.py file add:
def isEnabled(self):
    return True
3.1.2.3.5. Full Python code
Below is a full code in myPlugin.py which is done by following the
steps in the previous subsections.
1 2 3 4 5 6 7 8 9 10 11 12 13 14 15 16 17 18 19 20 21 22 23 24 25 26 27 28 29 30 31 32 33 34 35 36 37 38 39 40 41 42 43 44 45 46 47 48 49 50 51 52 53 54 55 56 57 58 59 60 61 62 63 64 65 66 67 68 69 70 71 72 73 74 75 76 77 78 79 80 81 82 | # modules for event logging system and for operating system dependent
# functionality
import logging, os
# IMASViz plugin sources
from imasviz.VizPlugins.VizPlugin import VizPlugin
# Matplotlib library
import matplotlib.pyplot as plt
class myPlugin(VizPlugin):
def __init__(self):
pass
def execute(self, vizAPI, pluginEntry):
"""Main plugin function.
"""
# Get dataSource from the VizAPI (IMASViz Application Program Interface)
# Note: instance of "self.datatreeView" is provided by the VizPlugins
# through inheritance
dataSource = vizAPI.GetDataSource(self.dataTreeView)
# Get case parameters (shot, run, machine user) from the dataSource
shot = dataSource.shotNumber
run = dataSource.runNumber
machine = dataSource.imasDbName
user = dataSource.userName
occurrence = 0
# Check if the IDS data is already loaded in IMASviz. If it is not,
# load it
if not vizAPI.IDSDataAlreadyFetched(self.dataTreeView, 'magnetics', occurrence):
logging.info('Loading magnetics IDS...')
vizAPI.LoadIDSData(self.dataTreeView, 'magnetics', occurrence)
# Get IDS
self.ids = dataSource.getImasEntry(occurrence)
# Displaying basic information
print('Reading data...')
print('Shot =', shot)
print('Run =', run)
print('User =', user)
print('Machine =', machine)
# Get some data from the IDS and pass it to plot (using matplotlib)
# - Set subplot
fig, ax = plt.subplots()
# - Extract X-axis values (time)
time_values = self.ids.magnetics.time
x = time_values
# - Get the size of AoS (number of arrays)
num_bpol_probe_AoS = len(self.ids.magnetics.bpol_probe)
# - For each array extract array values and create a plot
for i in range(num_bpol_probe_AoS):
# - Extract array values
y = self.ids.magnetics.bpol_probe[i].field.data
# - Set plot (line) defined by X and Y values +
# - set line as full line (-) and add legend label.
ax.plot(x, y, '-', label='bpol_probe[' + str(i) + ']')
# - Enable grid
ax.grid()
# - Set axis labels and plot title
ax.set(xlabel='time [s]', ylabel='Poloidal field probe values',
title='Poloidal field probe')
# - Enable legend
ax.legend()
# - Draw/Show plots
plt.show()
def getEntries(self):
if self.selectedTreeNode.getIDSName() == "magnetics":
return [0]
def getPluginsConfiguration(self):
return None
def getAllEntries(self):
# Set a text which will be displayed in the pop-up menu
return [(0, 'Magnetics overview (simple plot plugin example)...')]
def isEnabled(self):
return True
|
3.1.2.3.6. Registering plugin in IMASViz
In order to register the plugin in IMASViz, a single entry is required in the
top part of the $VIZ_HOME/imasviz/VizPlugins/VizPlugin.py file.
In the RegisteredPlugins dictionary add key and corresponding value relevant for your plugin, e.g. 'myPlugin' : 'viz_my_plugin.myPlugin'.
Here the key must match the py. file and class name while the corresponding value must match '<plugin_source_path>.<py_file_name.py>'.
In this case, it should look something like this:
RegisteredPlugins = {'equilibriumcharts':'viz_equi.equilibriumcharts',
                     'ToFuPlugin':'viz_tofu.viz_tofu_plugin',
                     'SOLPS_UiPlugin': '',
                     'CompareFLT1DPlugin':'viz_tests.CompareFLT1DPlugin',
                     'viz_example_plugin':'viz_example_plugin.viz_example_plugin',
                     'example_UiPlugin': '',
                     'simplePlotPluginExample' : 'viz_simple_plot_example.simplePlotPluginExample',
                     'ETSpluginIMASViz' : 'viz_ETS.ETSpluginIMASViz',
                     'myPlugin' : 'viz_my_plugin.myPlugin'
                     }
3.1.2.3.7. Executing the custom plugin in IMASViz
To run the plugin in IMASViz while in IMASViz session with opened IDS database, in tree view browser:
on the IDS previously specified in getEntries() method function (Magnetics IDS) either:
hold shift key + right-click on the tree node. A popup menu including the menu action (with label previously specified in getAllEntries()) will be shown, or
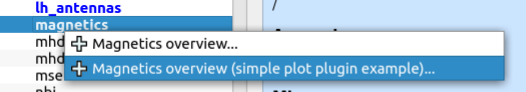
Popup menu on shift + right-click on Magnetics IDS showing the available action for executing the plugin.
just right-click on the tree node. A popup menu including the Plugin selection will be shown. Hovering on this selection will shown the menu action (with label previously specified in getAllEntries()).
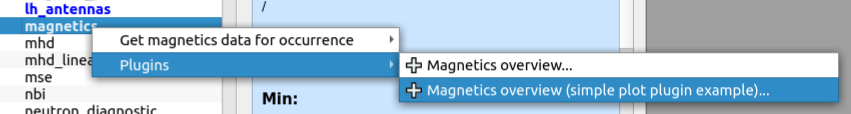
Popup menu on right-click on Magnetics IDS showing the available action for executing the plugin.
click on the menu action. The plugin will be executed and the results (plot) will be shown in a matplotlib plot window.
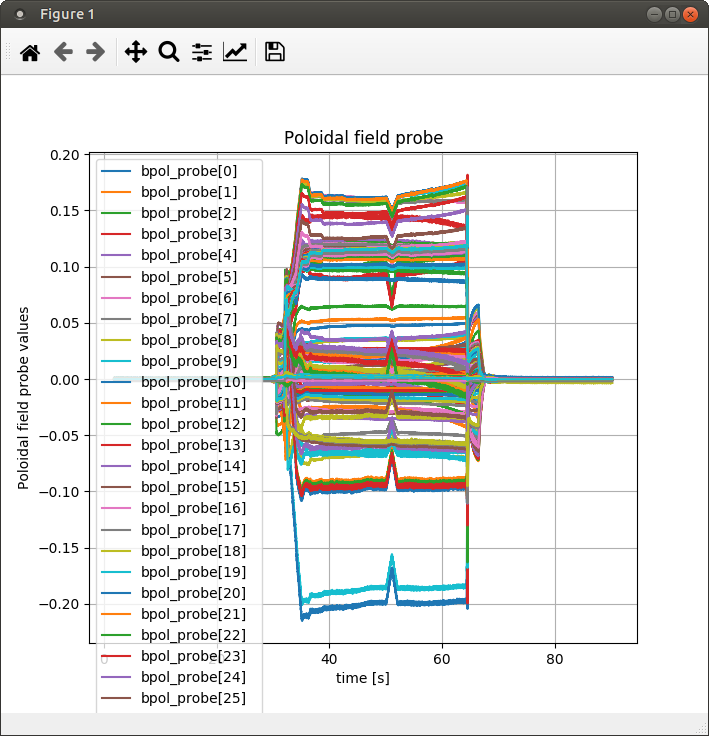
The result of the simple plot plugin execution: plotted poloidal field probe values (all available signals).