3.1.3. Developing a custom user interface (UI) plugins with Qt designer
Qt Designer is a tool for designing and building Qt-based graphical user interfaces. It allows the user to design custom widgets, dialogs, main windows, etc. using on-screen forms and a user-friendly simple drag-and-drop interface. It also provides the user with a convenient ability to preview the designs to ensure they work as intended.
In general, Qt Designer mainly offers basic Qt widgets such as Push Button, Line Edit, List Widget, etc. This list of the Qt Designer widgets can be extended by writing so-called Qt designer plugins (do not confuse with IMASViz plugins!). Normally this is done using C++ but PyQt5 also allows you to write Qt Designer plugins in Python3 programming language.
Such designer plugin is used to pass a custom widget source code (written in Python3) to Qt Designer. This way the widget becomes available within the Qt designer where it can be interactively moved, designed, connected to signals and slots and more.
Note
For more information on Qt Designer and PyQt5 based plugins and widgets check this link.
- In this HOWTO section it will be described how to:
Develop a custom PyQt5 widget
Pass the custom PyQt5 widget class to Qt designer as a Qt designer plugin
Use the custom PyQt5 widget as a Qt designer plugin within the Qt Designer
Design of a custom user interface (UI) plugin (which includes the custom Qt designer plugin) with Qt designer
Use the UI plugin in a standalone way as a PyQt5 application
Use the UI plugin in IMASViz
Warning
Qt version of used PyQt5 (compiled with Qt) and Qt designer must match!
For the purposes of this HowTo section, a widget source code for the Magnetics IDS overview Plugin was developed and it is available in the IMASViz source code (VizPlugins/viz_example). As it is mainly intended only as an example of a plugin (including an example of the widget source code), it is referred to mainly as an Example Plugin (same goes for source files - exampleWidget.py and exampleplugin.py, introduced later in this howTo section).
As and addition, below is a short demonstration video of SOLPS overview Plugin, showing an example of the processes listed in points 3-6. More on this plugin (as IMASViz plugin) can be found in section Plugins.
3.1.3.1. Custom PyQt5 widget creation (code development)
This section describes and demonstrates how to write a complete custom PyQt5 widget that handles data stored within the Magnetics IDS. Later in this HowTo section, the same widget will be then used to create Magnetics IDS overview Plugin using Qt designer.
The main final features of this custom plugin will be:
Opening and reading the contents a specified IDS (specified by the set case parameters)
OR
reading the contents of an IDS which was passed to the plugin by “host” application, and
convenient plotting of all flux_loop and poloidal field probe (AoS) signals found in the Magnetics IDS (arrays of values).
In this case, the whole widget source code is written in Python3 file named exampleWidget.py.
The final code can be already observed and compared here: Full final code of the example PyQt5 widget.
Note
It is highly recommended to have the finished code opened on the side while going through this HowTo section to better understand the whole code.
Note
It is recommended to have at least basic knowledge from programming (especially with Python programming language) before proceeding with the widget development instructions. A complete beginner might find those instructions a bit overwhelming.
The steps are split into the next subsections:
Code header
Import statements
Widget Class definition
3.1 Widget Constructor definition
3.2 Widget base “set” and “get” routines
3.3 Widget custom routines
PlotCanvas Class definition
4.1 PlotCanvas Constructor definition
4.2 PlotCanvas custom plotting routines
Running the code as the main program (standalone)
3.1.3.1.1. Code header
The header of the custom PyQt5 widget source code should contain the basic information about the code itself: - the source code (.py) filename, - short description and the purpose of this script - authors name and - authors contact (e-mail is most convenient).
1 2 3 4 5 6 7 8 9 10 11 12 13 14 15 16 | # Name : exampleWidget
#
# A PyQt5 widget to serve as an example of how to create custom widgets
# that can be used within Qt designer.
# This widget embeds Matplotlib canvas (plot space). It contains also
# defined PyQt5 slots for setting the magnetics IDS parameters and
# a slot (function) for executing the plot procedure,
# populating/filling the Matplotlib canvas.
#
# Author :
# Dejan Penko
# E-mail :
# dejan.penko@lecad.fs.uni-lj.si
#
#****************************************************
# Copyright(c) 2019- D. Penko
|
Documentation should be as important to a developer as all other facets of development. Every code should include documentation (in the forms of a header, code comments, etc.). It either explains what the code does, how it operates, how to use it etc. Documentation is an important part of software engineering.
No matter what the code contains, chances are that someday other users will try to understand and use it. Taking that extra time to write a proper description of the contents of the code will save huge amounts of time and effort for everybody to understand the code.
3.1.3.1.2. Import statements
The custom PyQt5 widget requires additional sources - modules.
The ones required in this case are:
The common system, OS and logging modules:
18 19 20 21 22 23 | # import module providing system-specific parameters and functions
import sys
# import module providing miscellaneous operating system interfaces
import os
# import module providing log handling
import logging
|
PyQt5 modules:
24 25 26 | # import modules providing PyQt5 parameters, functions etc.
from PyQt5.QtWidgets import QApplication, QWidget, QMainWindow, QVBoxLayout, QSizePolicy
from PyQt5.QtCore import pyqtSlot, pyqtSignal
|
Matplotlib modules and setting matplotlib to use the Qt rendering:
27 28 29 30 31 32 | # import module providing matplotlib parameters, functions etc.
import matplotlib
matplotlib.use('Qt5Agg') # Use Qt rendering
from matplotlib.figure import Figure
from matplotlib.backends.backend_qt5agg import FigureCanvasQTAgg as FigureCanvas
from matplotlib.backends.backend_qt5agg import NavigationToolbar2QT as NavigationToolbar
|
IMAS modules:
33 34 | # import module providing IMAS and IDS-related parameters, functions etc.
import imas
|
3.1.3.1.3. Widget class
This section describes and demonstrates how to define a new widget class in Python3.
3.1.3.1.3.1. Class definition
The initial and important part of this code is the definition of a new class inheriting from the PyQt5 QWidget class. In this case, the class is named exampleWidget.
This class will later fully define the QWidget (contents, design, functions related to the widget and more).
36 37 38 39 | class exampleWidget(QWidget):
"""A widget for opening magnetics IDS, extracting the flux loop or
poloidal probe quantities and plotting them to matplotlib figure canvas.
"""
|
Note
Do not forget to describe the class - what is its purpose etc.
Here also a new PyQt signal is set, which will be needed later in code.
41 42 | # Create a custom signal
idsSet = pyqtSignal(bool)
|
In short, the signal on its own does not perform any action. Instead, it is
connected to a slot. The slot can be any callable Python function.
When the signal gets emitted the connected slot (Python function) gets called.
Note
More on signal and slots: Link
3.1.3.1.3.2. Constructor definition
In short, constructors are generally used for initiating an object. The task of constructors is to initialize the data members of the class when an object of the class is created.
In the case of this custom widget, the constructor required two additional arguments:
parent (can be either Qt object, later our case QMainWindow), and
ids (an IDS object).
Both arguments are set as None (default values).
44 45 46 47 48 49 50 51 52 53 54 55 56 57 | def __init__(self, parent=None, ids=None, *args, **kwargs):
"""
Arguments:
parent (PyQt5 object) : Qt widget parent (e.g. QMainWindow)
ids (IDS object) : IDS object - optional parameter.
This widget does not require IDS object in
order to work (the default IDS parameters
will be used to open the IDS).
However, if an IDS object is already
available it can be passed to the widget
to be used instead (for example, passing
the IDS object from the IMASViz to this
widget).
"""
|
And the ids object is set with:
65 66 67 | # Set IDS object
# Note: if not provided as an argument it will be set to None
self.ids = ids
|
Regarding the ids object, the main idea is to make our widget capable of performing in two different ways. Either:
use IDS object passed to the widget (in which case ids != None),
if no IDS object was passed (ids == None), open IDS and create a new ids object.
For example, in IMASViz there is at least one IDS open at the time and thus have the ids object available. Instead of opening the IDS again, the ids object can be just passed to the custom widget as an argument and the widget can continue to use it.
If there is no IDS object available (meaning no IDS is already being opened), an IDS must be opened thus creating an object referring to the IDS. In the constructor we define a dictionary labeled as self.idsParameters which should contain all IDS parameters for IDS (will be used later to open the needed IDS):
69 70 71 72 73 74 75 76 77 78 79 80 81 82 83 | # Set IDS case parameters
# - Empty dictionary
self.idsParameters = {}
# - shot
self.idsParameters['shot'] = '52344'
# - run r
self.idsParameters['run'] = '0'
# - user
self.idsParameters['user'] = os.getenv('USER')
# - device / machine / database name
self.idsParameters['device'] = 'viztest'
# - IMAS major version (3.x.y)
self.idsParameters['IMAS major version'] = '3'
# - label of the IDS to be used
self.idsParameters['idsName'] = 'magnetics'
|
Constructor should contain also a check if the widget is being run in a desktop
environment. This is mandatory as this is a widget which deals with GUI and
visualization. The code should not be run from a “terminal-only” environment (for
example ssh user@host etc.).
In this case we define a function named checkDisplay():
188 189 190 191 192 193 | @pyqtSlot()
def checkDisplay(self):
try:
os.environ['DISPLAY']
except:
logging.error('No display available!')
|
and execute it in the constructor:
61 62 63 | # Check if display is available (display is mandatory, as this is
# PyQt5 widget)
self.checkDisplay()
|
Lastly, a widget layout and its contents need to be defined (plot canvas and matplotlib navigation toolbar):
Note
The PlotCanvas class definition and the definition of its routines will be done in the following sections.
85 86 87 88 89 90 91 92 93 | # Set widget layout
self.setLayout(QVBoxLayout())
# Set empty matplotlib canvas
self.canvas = PlotCanvas(self)
# Set matplotlib toolbar
self.toolbar = NavigationToolbar(self.canvas, self)
# Add canvas and toolbar to widget layout
self.layout().addWidget(self.canvas)
self.layout().addWidget(self.toolbar)
|
3.1.3.1.3.3. Base “set” and “get” routines
For setting and getting/returning the IDS case parameters, the definition of a few set/get routines is required.
The set routines must be set as slots (@pyqtSlot). This clearly marks the function as a slot for PyQt5 and it also increases its speed and performance when being executed as slots in PyQt5 applications.
The get routines are simple functions which return one variable value.
146 147 148 149 150 151 152 153 154 155 156 157 158 159 160 161 162 163 164 165 166 167 168 169 170 171 172 173 174 175 176 177 178 179 180 181 182 183 184 185 186 | @pyqtSlot(str)
def setShot(self, shot):
self.idsParameters['shot'] = shot
def getShot(self):
return self.idsParameters['shot']
@pyqtSlot(str)
def setRun(self, run):
self.idsParameters['run'] = run
def getRun(self):
return self.idsParameters['run']
@pyqtSlot(str)
def setUser(self, user):
self.idsParameters['user'] = user
def getUser(self):
return self.idsParameters['user']
@pyqtSlot(str)
def setDevice(self, device):
self.idsParameters['device'] = device
def getDevice(self):
return self.idsParameters['device']
@pyqtSlot(str)
def setIMASmVer(self, ver):
self.idsParameters['IMAS major version'] = ver
def getIMASmVer(self):
return self.idsParameters['IMAS major version']
@pyqtSlot(str)
def setIDSname(self, idsName):
self.idsParameters['idsName'] = idsName
def getIDSname(self):
return self.idsParameters['idsName']
|
3.1.3.1.3.4. Custom functions (routines)
The first “bundle” of functions deals with IDSs:
1. openIDS: for opening the IDS (using the IDS case parameters, defined with the self.idsParameters dictionary),
125 126 127 128 129 130 131 132 133 134 135 136 | @pyqtSlot()
def openIDS(self):
"""Open magnetics IDS.
"""
# Open IDS
self.ids = imas.ids(int(self.idsParameters['shot']),
int(self.idsParameters['run']))
self.ids.open_env(self.idsParameters['user'],
self.idsParameters['device'],
self.idsParameters['IMAS major version'])
# Get magnetics IDS
self.ids.magnetics.get()
|
2. setIDS: for setting the IDS object (self.ids). Here also the emit signal statement is included. This way every time this function will be called/executed, this signal will get emmited. Later in the plugin this signal will be used to initiate the execution of certain functions on signal-emit.
138 139 140 141 | def setIDS(self, ids):
self.ids = ids
# Emit signal indicating that the IDS object is set
self.idsSet.emit(False)
|
3. getIDS: for getting/returning the IDS object (self.ids).
143 144 | def getIDS(self):
return self.ids
|
The second “bundle” of functions deals with executing the plotting procedures to populate the matplotlib canvas. At this point in this tutorial, the PlotCanvas class is not yet defined. This will be done in the next HowTo section. The functions needed are:
plotFluxAoS: for plotting all Flux_loop signal arrays values, and
plotBPolAoS: for plotting all poloidal field probe signal arrays values
95 96 97 98 99 100 101 102 103 104 105 106 107 108 109 110 111 112 113 114 115 116 117 118 119 120 121 122 123 | @pyqtSlot()
def plotFluxAoS(self):
"""Plot Flux Loop arrays to canvas.
"""
# IDS check
if self.ids == None:
logging.error(' IDS was not set/opened!')
return
# Canvas figure check
if self.canvas.figure != None:
self.canvas.figure.clear()
# Plot flux loop Aos
self.canvas.plotFluxAoS(self.ids)
@pyqtSlot()
def plotBPolAoS(self):
"""Plot poloidal field probe arrays to canvas.
"""
# IDS check
if self.ids == None:
logging.error(' IDS was not set/opened!')
return
# Canvas figure check
if self.canvas.figure != None:
self.canvas.figure.clear()
# Plot Poloidal field AoS
self.canvas.plotBPolAoS(self.ids)
|
3.1.3.1.4. PlotCanvas
This section describes and demonstrates how to define a new matplotlib FigureCanvas class in Python3.
3.1.3.1.4.1. Class definition
Second main part this code (with the first being the definition of the exampleWindget class) is the definition of a new class inheriting from the matplotlib FigureCanvas class. In this case, the class is named PlotCanvas.
This class will later fully define the matplotlib plot frame (canvas) and functions related to it.
195 196 197 198 | class PlotCanvas(FigureCanvas):
"""Matplotlib figure canvas that is to be embedded within the widget.
FigureCanvas is the area onto which the figure is drawn
"""
|
3.1.3.1.4.2. Constructor definition
In this case the constructor takes 4 additional arguments:
parent (our custom QWidget),
width (canvas width),
height (canvas height), and
dpi (dots per inch).
The parent argument is set as None, width to 5, height to 5 and dpi to 100 (default values).
200 201 202 203 204 205 206 207 | def __init__(self, parent=None, width=5, height=4, dpi=100):
"""
Arguments:
parent (PyQt5 object) : PyQt5 parent (e.g. QWidget).
width (int) : Canvas width.
height (int) : Canvas height.
dpi (int) : Dots per inch.
"""
|
Next, a figure object fig is set:
Note
Figure routine is taken from the import statement (see Import statements).
109 110 111 112 113 114 115 116 117 118 119 120 121 122 123 124 125 126 127 128 129 130 131 132 133 134 135 136 137 138 139 140 141 142 143 144 145 146 147 148 149 150 151 152 153 154 155 156 157 158 159 160 161 162 163 164 165 166 167 168 169 170 171 172 173 174 175 176 177 178 179 180 181 182 183 184 185 186 187 188 189 190 191 192 193 194 195 196 197 198 199 200 201 202 203 204 205 206 207 208 209 210 |
@pyqtSlot()
def plotBPolAoS(self):
"""Plot poloidal field probe arrays to canvas.
"""
# IDS check
if self.ids == None:
logging.error(' IDS was not set/opened!')
return
# Canvas figure check
if self.canvas.figure != None:
self.canvas.figure.clear()
# Plot Poloidal field AoS
self.canvas.plotBPolAoS(self.ids)
@pyqtSlot()
def openIDS(self):
"""Open magnetics IDS.
"""
# Open IDS
self.ids = imas.ids(int(self.idsParameters['shot']),
int(self.idsParameters['run']))
self.ids.open_env(self.idsParameters['user'],
self.idsParameters['device'],
self.idsParameters['IMAS major version'])
# Get magnetics IDS
self.ids.magnetics.get()
def setIDS(self, ids):
self.ids = ids
# Emit signal indicating that the IDS object is set
self.idsSet.emit(False)
def getIDS(self):
return self.ids
@pyqtSlot(str)
def setShot(self, shot):
self.idsParameters['shot'] = shot
def getShot(self):
return self.idsParameters['shot']
@pyqtSlot(str)
def setRun(self, run):
self.idsParameters['run'] = run
def getRun(self):
return self.idsParameters['run']
@pyqtSlot(str)
def setUser(self, user):
self.idsParameters['user'] = user
def getUser(self):
return self.idsParameters['user']
@pyqtSlot(str)
def setDevice(self, device):
self.idsParameters['device'] = device
def getDevice(self):
return self.idsParameters['device']
@pyqtSlot(str)
def setIMASmVer(self, ver):
self.idsParameters['IMAS major version'] = ver
def getIMASmVer(self):
return self.idsParameters['IMAS major version']
@pyqtSlot(str)
def setIDSname(self, idsName):
self.idsParameters['idsName'] = idsName
def getIDSname(self):
return self.idsParameters['idsName']
@pyqtSlot()
def checkDisplay(self):
try:
os.environ['DISPLAY']
except:
logging.error('No display available!')
class PlotCanvas(FigureCanvas):
"""Matplotlib figure canvas that is to be embedded within the widget.
FigureCanvas is the area onto which the figure is drawn
"""
def __init__(self, parent=None, width=5, height=4, dpi=100):
"""
Arguments:
parent (PyQt5 object) : PyQt5 parent (e.g. QWidget).
width (int) : Canvas width.
height (int) : Canvas height.
dpi (int) : Dots per inch.
"""
# Set figure
fig = Figure(figsize=(width, height), dpi=dpi)
|
Next, the (by class) inherited FigureCanvas constructor is executed. The fig object is passed to it as an argument. This way the figure is embedded within the matplotlib canvas.
211 212 | # Set canvas (pass figure)
FigureCanvas.__init__(self, fig)
|
Next, the parent of the FigureCanvas is set:
213 214 | # Set canvas parent
self.setParent(parent)
|
Lastly, the FigureCanvas size policy is set.
215 216 217 218 | # Set canvas size policy
FigureCanvas.setSizePolicy(self,
QSizePolicy.Expanding,
QSizePolicy.Expanding)
|
The whole PlotCanvas constructor code:
200 201 202 203 204 205 206 207 208 209 210 211 212 213 214 215 216 217 218 | def __init__(self, parent=None, width=5, height=4, dpi=100):
"""
Arguments:
parent (PyQt5 object) : PyQt5 parent (e.g. QWidget).
width (int) : Canvas width.
height (int) : Canvas height.
dpi (int) : Dots per inch.
"""
# Set figure
fig = Figure(figsize=(width, height), dpi=dpi)
# Set canvas (pass figure)
FigureCanvas.__init__(self, fig)
# Set canvas parent
self.setParent(parent)
# Set canvas size policy
FigureCanvas.setSizePolicy(self,
QSizePolicy.Expanding,
QSizePolicy.Expanding)
|
3.1.3.1.4.3. Custom plotting functions
There are two plotting functions required:
plotFluxAoS, for plotting all flux_loop signal arrays, and
plotBPolAoS, for plotting all poloidal field probe signal arrays values.
Both are very similar, the only difference between them is which data is extracted from the IDS and used for plotting. Because of this similarity, only the function plotFluxAoS will be described in depth.
The function plotFluxAoS requires only one argument: the IDS object. The function must also set the provided ids object to self.ids object.
220 221 222 223 224 225 226 227 228 229 230 231 232 233 | def plotFluxAoS(self, ids):
"""Plot values found in flux loops AoS.
Arguments:
ids (IDS object) : IDS object referring to the IDS from which the
data is to be extracted.
"""
# Add/Update IDS reference to the object (figure canvas)
self.ids = ids
# IDS check
if self.ids == None:
logging.error('IDS was not set/opened!')
return
|
Next, figure subplot must be set:
234 235 | # Set subplot
ax = self.figure.add_subplot(111)
|
Next, the time values must be extracted and assigned to time_values array. The time values will correspond to plot X-axis, thus, for easier representation, a new array x can be defined and the same values assigned to it.
236 237 238 | # Extract X-axis values (time)
time_values = self.ids.magnetics.time
x = time_values
|
Next, looping through all structured of the flux_loop AoS is required. Each array values (Y-axis values) need to be extracted and then together with the previously set time values (X-axis) a new plot can be added to the matplotlib figure. Because of the loop, this gets repeated until no more AoS arrays are left.
239 240 241 242 243 244 245 246 247 | # Get the size of AoS (number of arrays)
num_flux_loop_AoS = len(self.ids.magnetics.flux_loop)
# For each array extract array values and create a plot
for i in range(num_flux_loop_AoS):
# Extract array values
y = self.ids.magnetics.flux_loop[i].flux.data
# Set plot (line) defined by X and Y values +
# set line as full line (-) and add legend label.
ax.plot(x, y, '-', label='Flux_loop[' + str(i) + ']')
|
Next, few additional modifications are required:
enabling plot grid,
setting X-axis, Y-axis label,
setting plot title,
enabling legend, and
drawing the plot.
248 249 250 251 252 253 254 255 256 | # Enable grid
ax.grid()
# Set axis labels and plot title
ax.set(xlabel='time [s]', ylabel='Flux Loop values',
title='Flux loop')
# Enable legend
ax.legend()
# Draw/Show plots
self.draw()
|
Final plotFluxAoS code:
220 221 222 223 224 225 226 227 228 229 230 231 232 233 234 235 236 237 238 239 240 241 242 243 244 245 246 247 248 249 250 251 252 253 254 255 256 | def plotFluxAoS(self, ids):
"""Plot values found in flux loops AoS.
Arguments:
ids (IDS object) : IDS object referring to the IDS from which the
data is to be extracted.
"""
# Add/Update IDS reference to the object (figure canvas)
self.ids = ids
# IDS check
if self.ids == None:
logging.error('IDS was not set/opened!')
return
# Set subplot
ax = self.figure.add_subplot(111)
# Extract X-axis values (time)
time_values = self.ids.magnetics.time
x = time_values
# Get the size of AoS (number of arrays)
num_flux_loop_AoS = len(self.ids.magnetics.flux_loop)
# For each array extract array values and create a plot
for i in range(num_flux_loop_AoS):
# Extract array values
y = self.ids.magnetics.flux_loop[i].flux.data
# Set plot (line) defined by X and Y values +
# set line as full line (-) and add legend label.
ax.plot(x, y, '-', label='Flux_loop[' + str(i) + ']')
# Enable grid
ax.grid()
# Set axis labels and plot title
ax.set(xlabel='time [s]', ylabel='Flux Loop values',
title='Flux loop')
# Enable legend
ax.legend()
# Draw/Show plots
self.draw()
|
As already stated, plotBPolAoS function code is almost identical to plotFluxAoS code.
Final plotBPolAoS:
258 259 260 261 262 263 264 265 266 267 268 269 270 271 272 273 274 275 276 277 278 279 280 281 282 283 284 285 286 287 288 289 290 291 292 293 | def plotBPolAoS(self, ids):
"""Plot poloidal field probe values.
Arguments:
ids (IDS object) : IDS object referring to the IDS from which the
data is to be extracted.
"""
# Add/Update IDS reference to the object (figure canvas)
self.ids = ids
# IDS check
if self.ids == None:
logging.error('IDS was not set/opened!')
return
# Set subplot
ax = self.figure.add_subplot(111)
# Extract X-axis values (time)
time_values = self.ids.magnetics.time
x = time_values
# Get the size of AoS (number of arrays)
num_bpol_probe_AoS = len(self.ids.magnetics.bpol_probe)
# For each array extract array values and create a plot
for i in range(num_bpol_probe_AoS):
# Extract array values
y = self.ids.magnetics.bpol_probe[i].field.data
# Set plot (line) defined by X and Y values +
# set line as full line (-) and add legend label.
ax.plot(x, y, '-', label='bpol_probe[' + str(i) + ']')
# Enable grid
ax.grid()
# Set axis labels and plot title
ax.set(xlabel='time [s]', ylabel='Poloidal field probe values',
title='Poloidal field probe')
# Enable legend
ax.legend()
# Draw/Show plots
self.draw()
|
At this point the exampleWidget.py code is finished and ready for use.
3.1.3.1.5. Running the code as the main program (standalone)
To run this example widget in a standalone way, few more lines must be added to the exampleWidget.py.
This part of the code contains setting the QApplication, QMainWindow, initiating the exampleWidget class, reading the IDS (parameters are set in the exampleWidget constructor) and executing the plotting procedures.
295 296 297 298 299 300 301 302 303 304 305 306 307 308 309 310 311 312 313 314 315 316 317 | if __name__ == '__main__':
# Set application object
app = QApplication(sys.argv)
# Set main PyQt5 window
mainWindow = QMainWindow()
# Set window title
mainWindow.setWindowTitle('Example Widget')
# Set example widget object
ew = exampleWidget()
# Open IDS (magnetics IDS)
ew.openIDS()
# Plot Flux Loop arrays
ew.plotFluxAoS()
# Plot poloidal field probe arrays (an option other than plotFluxAoS)
# ew.plotBPolAoS()
# Set example widget as a central widget of the main window
mainWindow.setCentralWidget(ew)
# Show the main window
mainWindow.show()
# Keep the application running (until the 'exit application' command is
# executed
sys.exit(app.exec_())
|
The code can now be run from the terminal with the next command:
python3 exampleWidget.py
Note
Make sure that the IDS with the specified case parameters exists (done in Constructor definition using idsParameters dictionary)!
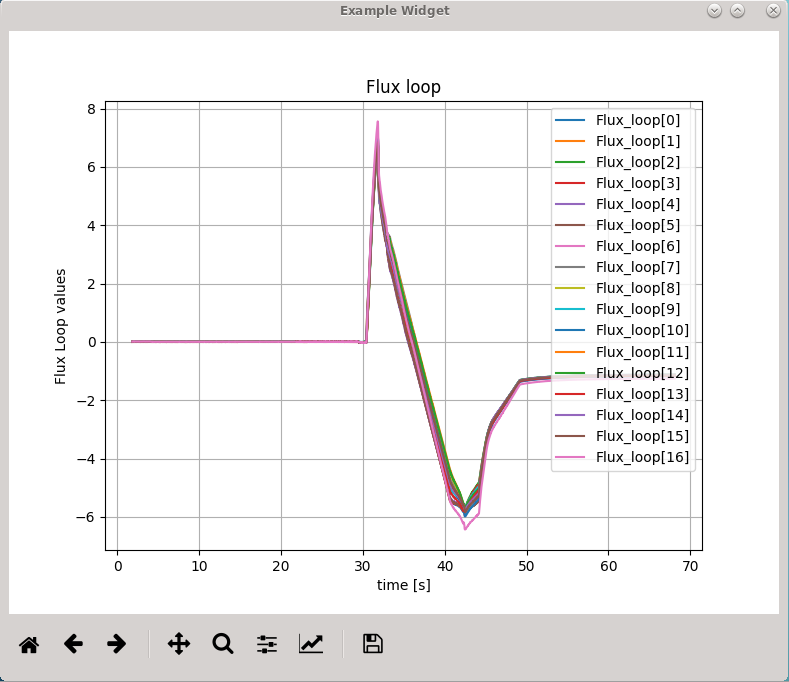
exampleWidget.py: Plotting all magnetics IDS arrays (17) of AoS flux_loop found in IDS (on GateWay HPC) shot: 52344; run: 0; user: g2penkod; device: viztest.
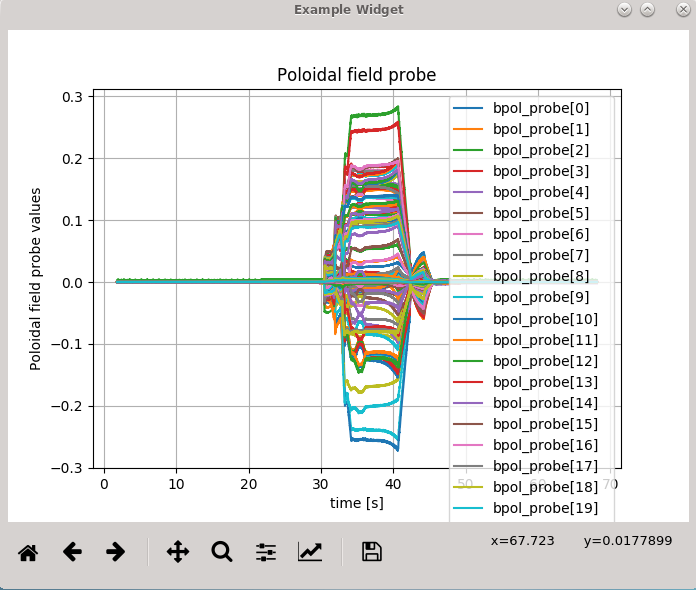
exampleWidget.py: Plotting all magnetics IDS arrays (ABOUT 130) of AoS bpol_probe found in IDS (on GateWay HPC) shot: 52344; run: 0; user: g2penkod; device: viztest.
3.1.3.1.6. Full final code of the example PyQt5 widget
1 2 3 4 5 6 7 8 9 10 11 12 13 14 15 16 17 18 19 20 21 22 23 24 25 26 27 28 29 30 31 32 33 34 35 36 37 38 39 40 41 42 43 44 45 46 47 48 49 50 51 52 53 54 55 56 57 58 59 60 61 62 63 64 65 66 67 68 69 70 71 72 73 74 75 76 77 78 79 80 81 82 83 84 85 86 87 88 89 90 91 92 93 94 95 96 97 98 99 100 101 102 103 104 105 106 107 108 109 110 111 112 113 114 115 116 117 118 119 120 121 122 123 124 125 126 127 128 129 130 131 132 133 134 135 136 137 138 139 140 141 142 143 144 145 146 147 148 149 150 151 152 153 154 155 156 157 158 159 160 161 162 163 164 165 166 167 168 169 170 171 172 173 174 175 176 177 178 179 180 181 182 183 184 185 186 187 188 189 190 191 192 193 194 195 196 197 198 199 200 201 202 203 204 205 206 207 208 209 210 211 212 213 214 215 216 217 218 219 220 221 222 223 224 225 226 227 228 229 230 231 232 233 234 235 236 237 238 239 240 241 242 243 244 245 246 247 248 249 250 251 252 253 254 255 256 257 258 259 260 261 262 263 264 265 266 267 268 269 270 271 272 273 274 275 276 277 278 279 280 281 282 283 284 285 286 287 288 289 290 291 292 293 294 295 296 297 298 299 300 301 302 303 304 305 306 307 308 309 310 311 312 313 314 315 316 317 | # Name : exampleWidget
#
# A PyQt5 widget to serve as an example of how to create custom widgets
# that can be used within Qt designer.
# This widget embeds Matplotlib canvas (plot space). It contains also
# defined PyQt5 slots for setting the magnetics IDS parameters and
# a slot (function) for executing the plot procedure,
# populating/filling the Matplotlib canvas.
#
# Author :
# Dejan Penko
# E-mail :
# dejan.penko@lecad.fs.uni-lj.si
#
#****************************************************
# Copyright(c) 2019- D. Penko
# import module providing system-specific parameters and functions
import sys
# import module providing miscellaneous operating system interfaces
import os
# import module providing log handling
import logging
# import modules providing PyQt5 parameters, functions etc.
from PyQt5.QtWidgets import QApplication, QWidget, QMainWindow, QVBoxLayout, QSizePolicy
from PyQt5.QtCore import pyqtSlot, pyqtSignal
# import module providing matplotlib parameters, functions etc.
import matplotlib
matplotlib.use('Qt5Agg') # Use Qt rendering
from matplotlib.figure import Figure
from matplotlib.backends.backend_qt5agg import FigureCanvasQTAgg as FigureCanvas
from matplotlib.backends.backend_qt5agg import NavigationToolbar2QT as NavigationToolbar
# import module providing IMAS and IDS-related parameters, functions etc.
import imas
class exampleWidget(QWidget):
"""A widget for opening magnetics IDS, extracting the flux loop or
poloidal probe quantities and plotting them to matplotlib figure canvas.
"""
# Create a custom signal
idsSet = pyqtSignal(bool)
def __init__(self, parent=None, ids=None, *args, **kwargs):
"""
Arguments:
parent (PyQt5 object) : Qt widget parent (e.g. QMainWindow)
ids (IDS object) : IDS object - optional parameter.
This widget does not require IDS object in
order to work (the default IDS parameters
will be used to open the IDS).
However, if an IDS object is already
available it can be passed to the widget
to be used instead (for example, passing
the IDS object from the IMASViz to this
widget).
"""
# Run QWidget constructor
super(QWidget, self).__init__(parent)
# Check if display is available (display is mandatory, as this is
# PyQt5 widget)
self.checkDisplay()
# Set IDS object
# Note: if not provided as an argument it will be set to None
self.ids = ids
# Set IDS case parameters
# - Empty dictionary
self.idsParameters = {}
# - shot
self.idsParameters['shot'] = '52344'
# - run r
self.idsParameters['run'] = '0'
# - user
self.idsParameters['user'] = os.getenv('USER')
# - device / machine / database name
self.idsParameters['device'] = 'viztest'
# - IMAS major version (3.x.y)
self.idsParameters['IMAS major version'] = '3'
# - label of the IDS to be used
self.idsParameters['idsName'] = 'magnetics'
# Set widget layout
self.setLayout(QVBoxLayout())
# Set empty matplotlib canvas
self.canvas = PlotCanvas(self)
# Set matplotlib toolbar
self.toolbar = NavigationToolbar(self.canvas, self)
# Add canvas and toolbar to widget layout
self.layout().addWidget(self.canvas)
self.layout().addWidget(self.toolbar)
@pyqtSlot()
def plotFluxAoS(self):
"""Plot Flux Loop arrays to canvas.
"""
# IDS check
if self.ids == None:
logging.error(' IDS was not set/opened!')
return
# Canvas figure check
if self.canvas.figure != None:
self.canvas.figure.clear()
# Plot flux loop Aos
self.canvas.plotFluxAoS(self.ids)
@pyqtSlot()
def plotBPolAoS(self):
"""Plot poloidal field probe arrays to canvas.
"""
# IDS check
if self.ids == None:
logging.error(' IDS was not set/opened!')
return
# Canvas figure check
if self.canvas.figure != None:
self.canvas.figure.clear()
# Plot Poloidal field AoS
self.canvas.plotBPolAoS(self.ids)
@pyqtSlot()
def openIDS(self):
"""Open magnetics IDS.
"""
# Open IDS
self.ids = imas.ids(int(self.idsParameters['shot']),
int(self.idsParameters['run']))
self.ids.open_env(self.idsParameters['user'],
self.idsParameters['device'],
self.idsParameters['IMAS major version'])
# Get magnetics IDS
self.ids.magnetics.get()
def setIDS(self, ids):
self.ids = ids
# Emit signal indicating that the IDS object is set
self.idsSet.emit(False)
def getIDS(self):
return self.ids
@pyqtSlot(str)
def setShot(self, shot):
self.idsParameters['shot'] = shot
def getShot(self):
return self.idsParameters['shot']
@pyqtSlot(str)
def setRun(self, run):
self.idsParameters['run'] = run
def getRun(self):
return self.idsParameters['run']
@pyqtSlot(str)
def setUser(self, user):
self.idsParameters['user'] = user
def getUser(self):
return self.idsParameters['user']
@pyqtSlot(str)
def setDevice(self, device):
self.idsParameters['device'] = device
def getDevice(self):
return self.idsParameters['device']
@pyqtSlot(str)
def setIMASmVer(self, ver):
self.idsParameters['IMAS major version'] = ver
def getIMASmVer(self):
return self.idsParameters['IMAS major version']
@pyqtSlot(str)
def setIDSname(self, idsName):
self.idsParameters['idsName'] = idsName
def getIDSname(self):
return self.idsParameters['idsName']
@pyqtSlot()
def checkDisplay(self):
try:
os.environ['DISPLAY']
except:
logging.error('No display available!')
class PlotCanvas(FigureCanvas):
"""Matplotlib figure canvas that is to be embedded within the widget.
FigureCanvas is the area onto which the figure is drawn
"""
def __init__(self, parent=None, width=5, height=4, dpi=100):
"""
Arguments:
parent (PyQt5 object) : PyQt5 parent (e.g. QWidget).
width (int) : Canvas width.
height (int) : Canvas height.
dpi (int) : Dots per inch.
"""
# Set figure
fig = Figure(figsize=(width, height), dpi=dpi)
# Set canvas (pass figure)
FigureCanvas.__init__(self, fig)
# Set canvas parent
self.setParent(parent)
# Set canvas size policy
FigureCanvas.setSizePolicy(self,
QSizePolicy.Expanding,
QSizePolicy.Expanding)
def plotFluxAoS(self, ids):
"""Plot values found in flux loops AoS.
Arguments:
ids (IDS object) : IDS object referring to the IDS from which the
data is to be extracted.
"""
# Add/Update IDS reference to the object (figure canvas)
self.ids = ids
# IDS check
if self.ids == None:
logging.error('IDS was not set/opened!')
return
# Set subplot
ax = self.figure.add_subplot(111)
# Extract X-axis values (time)
time_values = self.ids.magnetics.time
x = time_values
# Get the size of AoS (number of arrays)
num_flux_loop_AoS = len(self.ids.magnetics.flux_loop)
# For each array extract array values and create a plot
for i in range(num_flux_loop_AoS):
# Extract array values
y = self.ids.magnetics.flux_loop[i].flux.data
# Set plot (line) defined by X and Y values +
# set line as full line (-) and add legend label.
ax.plot(x, y, '-', label='Flux_loop[' + str(i) + ']')
# Enable grid
ax.grid()
# Set axis labels and plot title
ax.set(xlabel='time [s]', ylabel='Flux Loop values',
title='Flux loop')
# Enable legend
ax.legend()
# Draw/Show plots
self.draw()
def plotBPolAoS(self, ids):
"""Plot poloidal field probe values.
Arguments:
ids (IDS object) : IDS object referring to the IDS from which the
data is to be extracted.
"""
# Add/Update IDS reference to the object (figure canvas)
self.ids = ids
# IDS check
if self.ids == None:
logging.error('IDS was not set/opened!')
return
# Set subplot
ax = self.figure.add_subplot(111)
# Extract X-axis values (time)
time_values = self.ids.magnetics.time
x = time_values
# Get the size of AoS (number of arrays)
num_bpol_probe_AoS = len(self.ids.magnetics.bpol_probe)
# For each array extract array values and create a plot
for i in range(num_bpol_probe_AoS):
# Extract array values
y = self.ids.magnetics.bpol_probe[i].field.data
# Set plot (line) defined by X and Y values +
# set line as full line (-) and add legend label.
ax.plot(x, y, '-', label='bpol_probe[' + str(i) + ']')
# Enable grid
ax.grid()
# Set axis labels and plot title
ax.set(xlabel='time [s]', ylabel='Poloidal field probe values',
title='Poloidal field probe')
# Enable legend
ax.legend()
# Draw/Show plots
self.draw()
if __name__ == '__main__':
# Set application object
app = QApplication(sys.argv)
# Set main PyQt5 window
mainWindow = QMainWindow()
# Set window title
mainWindow.setWindowTitle('Example Widget')
# Set example widget object
ew = exampleWidget()
# Open IDS (magnetics IDS)
ew.openIDS()
# Plot Flux Loop arrays
ew.plotFluxAoS()
# Plot poloidal field probe arrays (an option other than plotFluxAoS)
# ew.plotBPolAoS()
# Set example widget as a central widget of the main window
mainWindow.setCentralWidget(ew)
# Show the main window
mainWindow.show()
# Keep the application running (until the 'exit application' command is
# executed
sys.exit(app.exec_())
|
3.1.3.2. Passing custom PyQt5 widget to Qt designer
In order to pass the custom PyQt5 widget to Qt designer, a separate Qt plugin Python file is required, written in Python3 programming language. The name of this file is of major importance as if set improperly the Qt designer will not recognize it! The name of this file should end with plugin.py (case sensitive!). In this case, the file is named exampleplugin.py. it must be placed in the same directory as the widget source code - exampleWidget.py.
This plugin .py file for Qt designer follows a certain template which can be used and slightly modified as required..
The whole code is shown below.
1 2 3 4 5 6 7 8 9 10 11 12 13 14 15 16 17 18 19 20 21 22 23 24 25 26 27 28 29 30 31 32 33 34 35 36 37 38 39 40 41 42 43 44 45 46 47 48 49 50 51 52 53 54 55 56 57 58 59 60 61 62 63 64 65 66 67 68 69 70 71 72 | #!/usr/bin/env python3
"""
An example of a widget as a Qt designer plugin. The widget plots magnetics IDS
data.
"""
from PyQt5.QtGui import QIcon, QPixmap
from PyQt5.QtDesigner import QPyDesignerCustomWidgetPlugin
from exampleWidget import exampleWidget
class exampleplugin(QPyDesignerCustomWidgetPlugin):
"""Plugin for exampleWidget functionality.
"""
def __init__(self, parent=None):
super(exampleplugin, self).__init__(parent)
def createWidget(self, parent):
return exampleWidget(parent=parent, ids=None)
def name(self):
return "exampleWidget"
def group(self):
return "IMASViz"
def icon(self):
return QIcon(_logo_pixmap)
def toolTip(self):
return "Plot magnetics IDS data."
def whatsThis(self):
return ""
def isContainer(self):
return False
def domXml(self):
return '<widget class="exampleWidget" name="exampleWidget">\n</widget>'
def includeFile(self):
return "exampleWidget"
# Define the image used for the icon.
# Note: This is IMASviz default pixmap.
_logo_16x16_xpm = [
"16 16 3 1 ",
" c black",
". c #0000E3",
"X c None",
"XXXXXXXXXXXXXXXX",
"XXXXXXXXXXXXXXXX",
"XXXXXXXXXXXXXXXX",
" XX X XX XX X",
" XX XX XX XX",
" XX X X XXX ",
" XX XX X XX X X",
"XXXXXXXXXXXXXXXX",
"................",
"XXXXXXXXXXXXXXXX",
"XXX XX X X XXX",
"XXX X XX XX XXXX",
"XXXX XX X XXXXX",
"XXXX XX X XXX",
"XXXXXXXXXXXXXXXX",
"XXXXXXXXXXXXXXXX"]
_logo_pixmap = QPixmap(_logo_16x16_xpm)
|
Below are listed lines of the Qt plugin code, which must be modified for any new widget, in order to properly refer to the widget source code - in this case exampleWidget (exampleWidget.py).
Import statement:
13 | from exampleWidget import exampleWidget
|
Class label:
15 | class exampleplugin(QPyDesignerCustomWidgetPlugin):
|
Class constructor:
18 19 | def __init__(self, parent=None):
super(exampleplugin, self).__init__(parent)
|
Returning custom widget object on createWidget.
Note
If widget constructor requires arguments they must be included here! In this case parent and ids.
21 22 | def createWidget(self, parent):
return exampleWidget(parent=parent, ids=None)
|
Name:
24 25 | def name(self):
return "exampleWidget"
|
Group:
27 28 | def group(self):
return "IMASViz"
|
Tool tip:
33 34 | def toolTip(self):
return "Plot magnetics IDS data."
|
XML attribute definition:
42 43 | def domXml(self):
return '<widget class="exampleWidget" name="exampleWidget">\n</widget>'
|
Include file:
45 46 | def includeFile(self):
return "exampleWidget"
|
Icon - pixmap (optional):
48 49 50 51 52 53 54 55 56 57 58 59 60 61 62 63 64 65 66 67 68 69 70 71 72 | # Define the image used for the icon.
# Note: This is IMASviz default pixmap.
_logo_16x16_xpm = [
"16 16 3 1 ",
" c black",
". c #0000E3",
"X c None",
"XXXXXXXXXXXXXXXX",
"XXXXXXXXXXXXXXXX",
"XXXXXXXXXXXXXXXX",
" XX X XX XX X",
" XX XX XX XX",
" XX X X XXX ",
" XX XX X XX X X",
"XXXXXXXXXXXXXXXX",
"................",
"XXXXXXXXXXXXXXXX",
"XXX XX X X XXX",
"XXX X XX XX XXXX",
"XXXX XX X XXXXX",
"XXXX XX X XXX",
"XXXXXXXXXXXXXXXX",
"XXXXXXXXXXXXXXXX"]
_logo_pixmap = QPixmap(_logo_16x16_xpm)
|
With the source and plugin code (.py files) completed they are ready to be used in Qt designer.
To achieve that, first the location of the necessary files must be provided to
the Qt designer. This is done by adding a path to the $PYQTDESIGNERPATH
system environment variable.
# Bash shell
export PYQTDESIGNERPATH=/path/to/source/files:${PYQTDESIGNERPATH}
# C-shell
setenv PYQTDESIGNERPATH /path/to/source/files:${PYQTDESIGNERPATH}
in this case
# Bash shell
export PYQTDESIGNERPATH=$VIZ_HOME/imasviz/VizPlugins/viz_example:${PYQTDESIGNERPATH}
# C-shell
setenv PYQTDESIGNERPATH $VIZ_HOME/imasviz/VizPlugins/viz_example:${PYQTDESIGNERPATH}
With this step completed the PyQt5 widget, now Qt Designer plugin, is ready to be used within Qt Designer.
3.1.3.3. Creating a custom application/plugin with Qt Designer
In this subsection, the process of creating a custom plugin/application GUI is presented. In Qt Designer, the GUI design and layout can be done conveniently with mouse drag-and-drop, popup-menu configurations and more.
Note
A good video presentation how to use Qt Designer is available in Developing a custom user interface (UI) plugins with Qt designer.
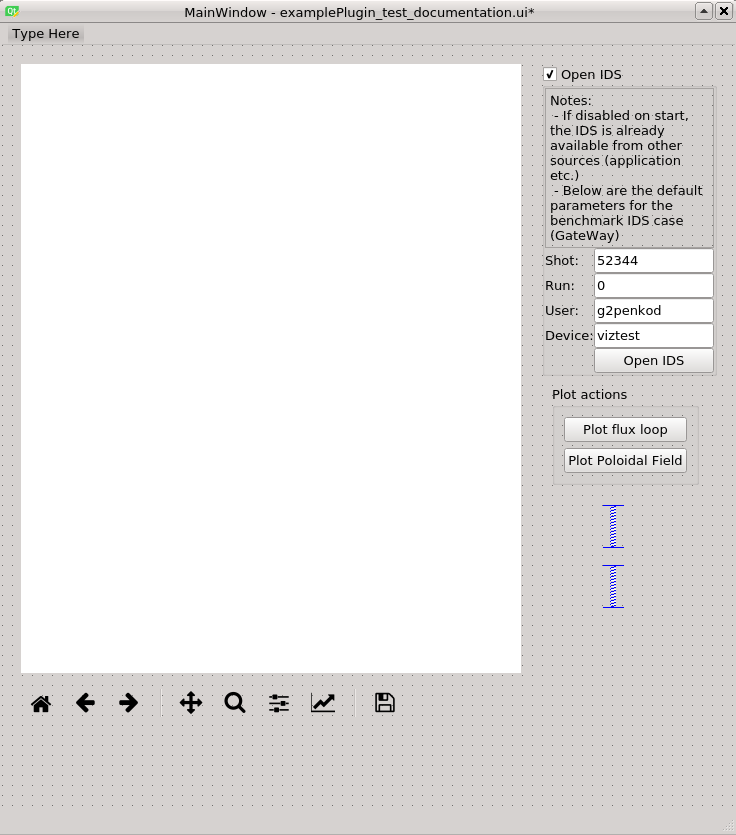
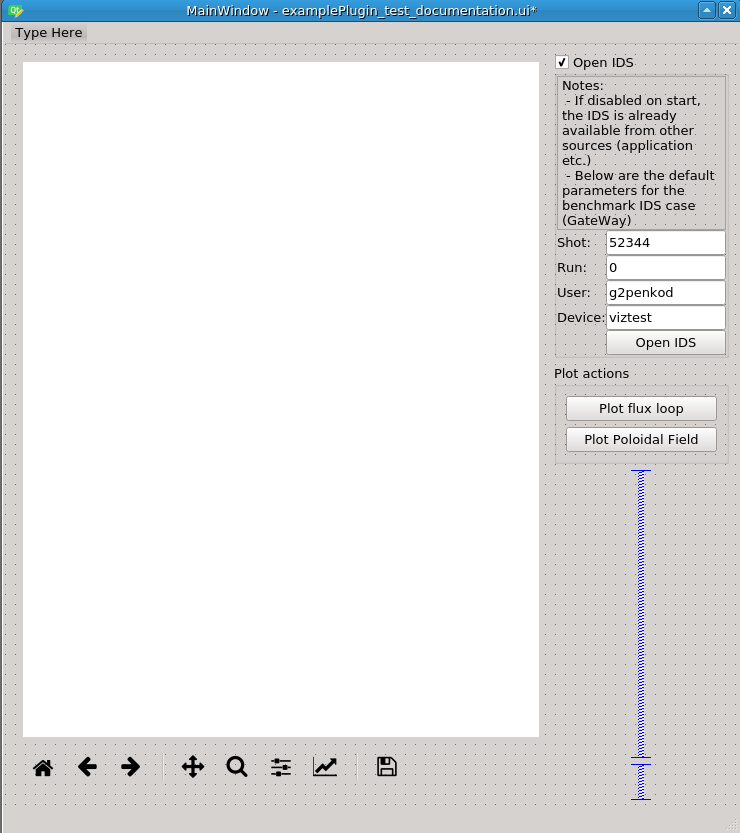
The figure below presents the final look at the end of the plugin GUI design procedure.
Final design of the example plugin, indented for plotting all slices of flux loop and poloidal field data found in magnetics IDS.
Before continuing, the environment must be set properly. On the GateWay, a few modules are required to be loaded first and the LD_LIBRARY_PATH environment variable must be extended:
# On the GateWay
module load itm-python3.6
module load itm-qt/5.8.0
setenv LD_LIBRARY_PATH ${ITM_PYTHON_PREFIX}/lib:${LD_LIBRARY_PATH}
The Qt designer can be then run by executing the next command in the terminal:
# On the GateWay
designer
A startup window will appear, as shown in the figure below.
Warning
Qt version of used PyQt5 (compiled with Qt) and Qt designer must match! Qt designer with Qt version X will not be able to find a plugin which source (widget code) was written using PyQt5 compiled with Qt version Y! The environment-setting instructions above were tested on the GateWay in the time of writing this HowTo section.
3.1.3.3.1. GUI design procedure
First, a new Main Window must be created. This is done by selecting The Main Window option from the list of templates/forms and clicking the Create button, as shown in the figure below.
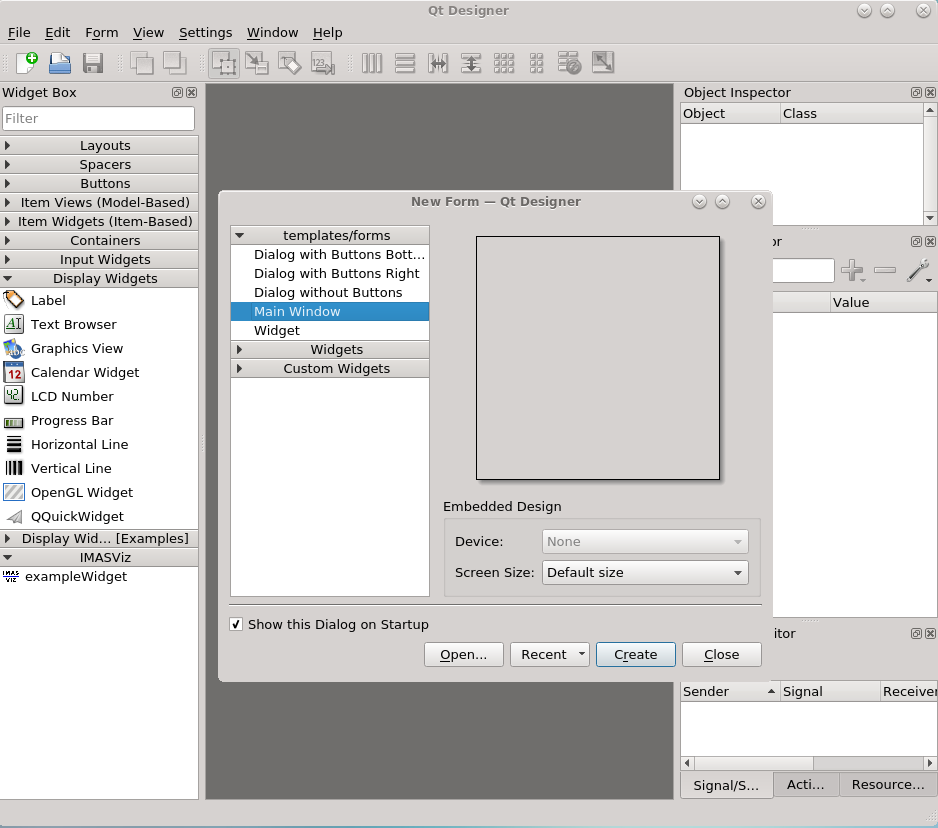
Qt designer startup window.
After this is done, on the far left side of the window lays a Widget Box which displays a collection of all available widgets. On the bottom of the list, a group IMASViz containing widget labeled exampleWidget can be found. This is the custom widget which was developed through the first half of this manual section. The group IMASViz was defined in the plugin.py file (def group).
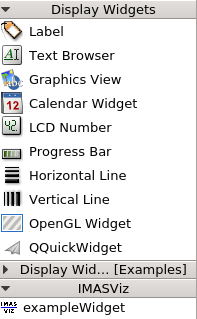
Custom widget (
exampleWidget) in Qt designer.¶Next, drag and drop exampleWidget to MainWindow. The result should be similar as in the figure below.
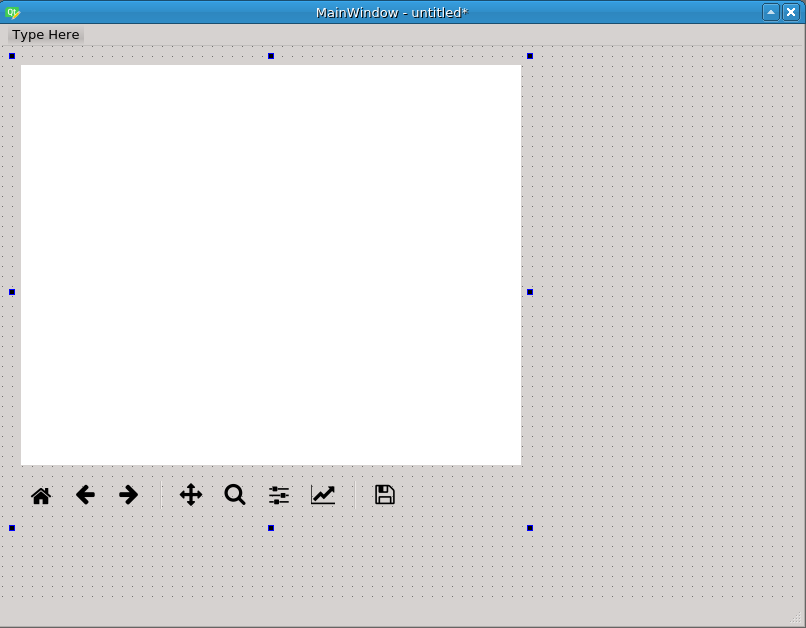
exampleWidget within MainWindow.
Next, drag and drop 2x Group Box and 2x vertical spacer.
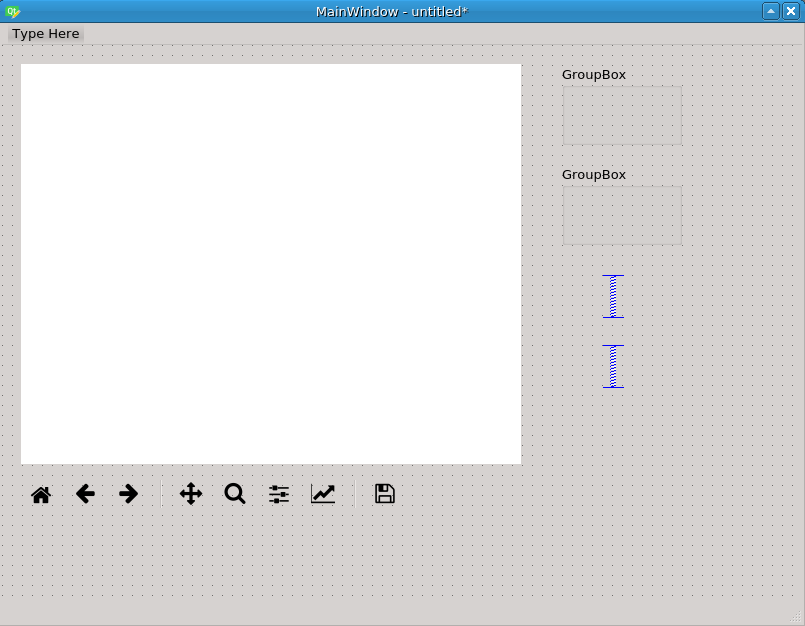
Added 2x Group Box and 2x vertical spacer to MainWindow.
In top Group Box:
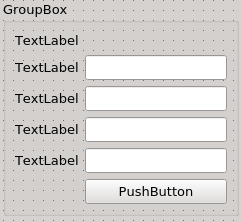
4.1. Add 5x Label, 4x LineEdit and 1x Push Button widgets.
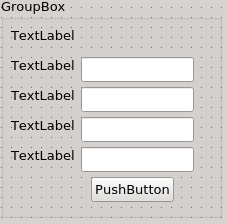
Rough Group Box design and layout.
4.2. Right click within the box and select Layout -> Lay Out in a Grid.
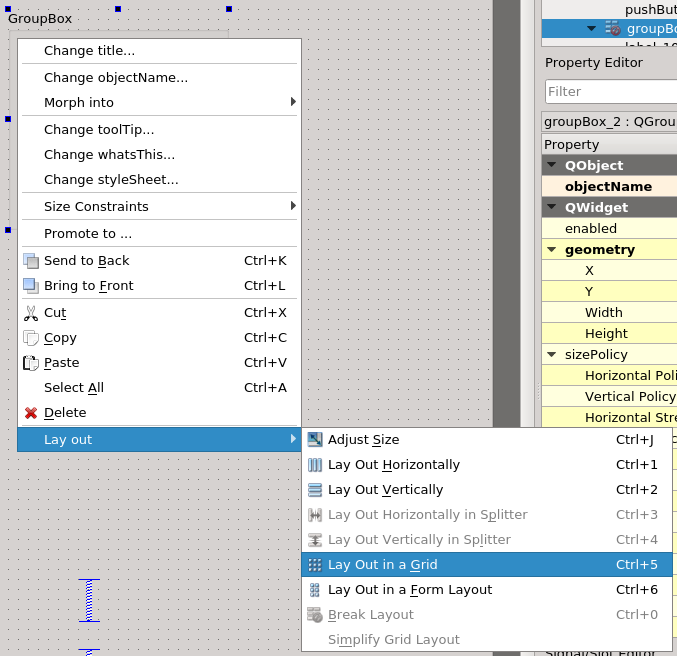
Grid layout in the top Group Box.
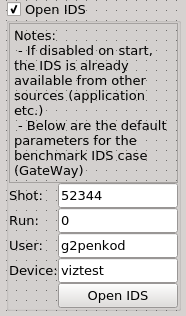
4.3. Set suitable texts to groupbox, Label and Push Button widgets. Set default values to LineEdit widgets.
Note
Top Label widget contains the next text:
Notes: \n - If disabled on start, the IDS is already available from other sources (application etc.) \n - Below are the default parameters for the benchmark IDS case (GateWay)
\n are required to achieve line breaks.
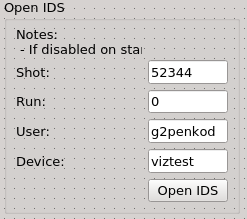
Top Group Box with set labels and default values.
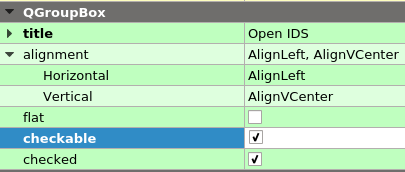
4.4. Select Group Box and change its next properties in the Property Editor found on the right side of the Qt Designer application:
QGroupBox -> checkable = True (check)
Group Box property
checkablefound in the Property Editor.¶QWidget -> sizePolicy -> Horizontal policy = Minimum
QWidget -> maximumSize -> Width = 175
Layout -> layoutLeftMargin = 0
Layout -> layoutTopMargin = 0
Layout -> layoutRightMargin = 0
Layout -> layoutBottomMargin = 0
Layout -> layoutHorizontalSpacing = 0
Layout -> layoutVerticalSpacing = 0
4.5. Select the top Label widget and change its next properties in the Property Editor:
QFrame -> frameShape = StyledPanel
QLabel -> wordwrap = True (checked)
Note
Manually (with mouse cursor) resize the Group Box and the Label to see the whole text of the top label.
4.6 Set next properties to all LineEdit widgets:
QWidget -> sizePolicy -> Horizontal policy = Minimum
QWidget -> sizePolicy -> Vertical policy = Fixed
Finished top Group Box.
In bottom Group Box:
5.1. Add 2x Push Button widget.
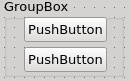
Bottom Group Box template.
5.2. Label the Group Box and Push Button widgets.
5.3. Right click within the box and select Layout -> Lay Out in a Grid.
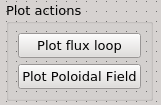
Finished bottom Group Box.
6. Right click within the MainWindow and select Layout -> Lay Out in a Grid.
Change MainWindow properties:
QWidget -> windowTitle = Magnetics IDS Overview Plugin
Change exampleWidget properties:
QObject -> objectName = mainPluginWidget
Warning
This property definition is crucial in the later sections in this HowTo manual when linking the plugin in IMASViz.
QWidget -> sizePolicy -> HorizontalPolicy = Expanding
QWidget -> sizePolicy -> VerticalPolicy = Expanding
3.1.3.3.2. Edit signals/slots
By editing signals/slots the wanted actions such as plot execution etc. are added to the widgets.
To edit signals/slots, in menubar, navigate to Edit -> Edit Signals/Slots
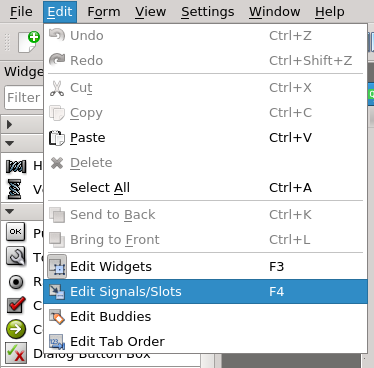
Edit Signals/Slots in menubar.
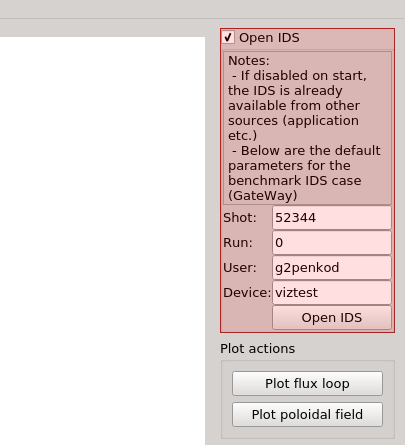
While in Edit Signals/Slots mode, hovering with the mouse over widgets marks them with slight red color.
Link Line Edit widgets (located in the top Group Box) signals to exampleWidget slots. This is done by clicking on one of the Line Edit widgets (in this case that one which holds the Shot value), holding and dragging the shown arrow to exampleWidget, as shown in the figure below.
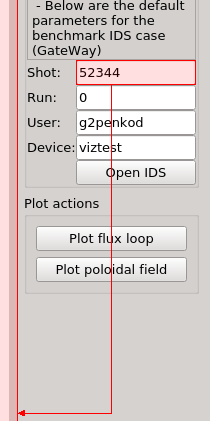
Next, the Configure connection editor will be shown.
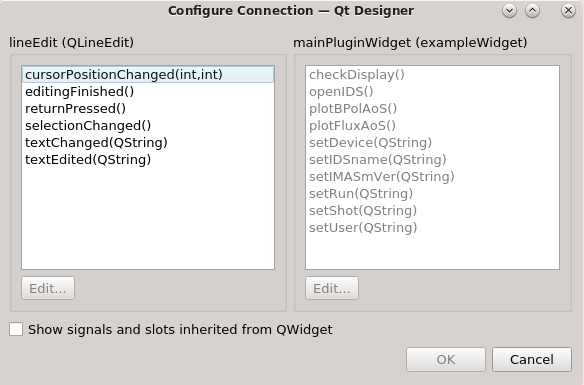
Configure connection editor, displaying list of available Line Edit (left) signals and available exampleWidget slots (right).
The slots are in this case actually functions/routines, which were defined in the exampleWidget source code (done in section Widget class).
In this case, when editing the text in Line Edit and applying the changes
(pressing enter key etc.) the changed value must be passed to the
exampleWidget. This is done by selecting the suitable signal and slot from
the lists: textEdited and setShot, and pressing the
OK button.
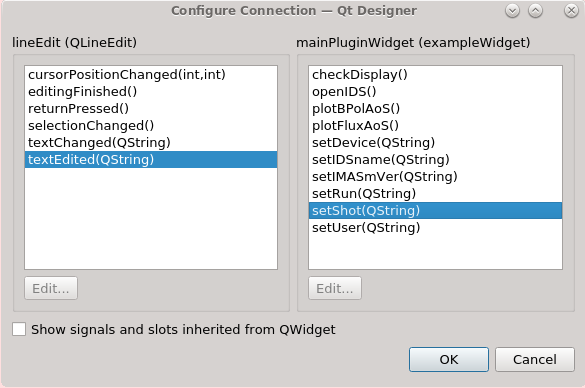
Selection of Line Edit signal textEdited and exampleWidget slot setShot
After that, while in the Edit Signals/Slots, the start and the end point of the red arrow will indicate which signal and slot are linked.
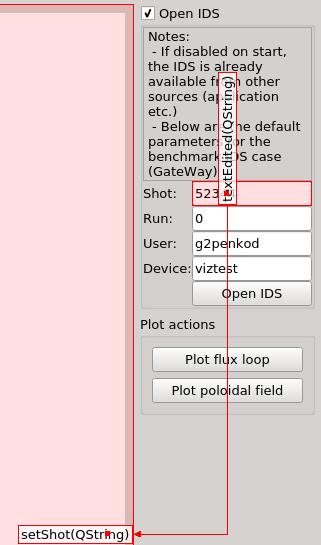
Red arrow indicating the sender, sender signal, receiver and slot.
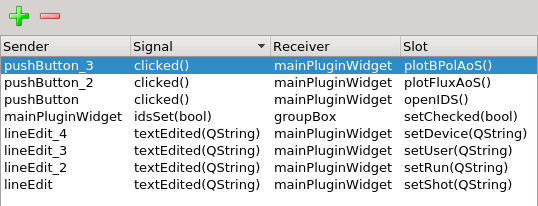
The whole list of created slot/signal links is shown on the bottom right corner of the Qt Designer application.
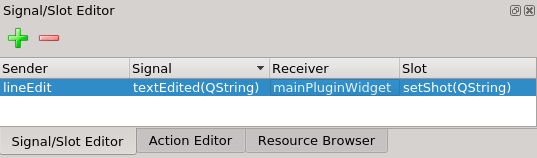
A list displaying a list of all created slot/signal lists, listing the sender, sender signal, receiver and slot for each link.
The same as the first link, few more links are required. Below is a detailed table listing all necessary links.
For easier interpretation, the sender and receiver in the table below are marked with their text label instead of their object name (used in the Qt Designer list of signal/slots).
SENDER |
RECEIVER |
|||
Type |
Label/Value |
Signal |
Type |
Signal |
Line Edit |
52344 |
textEdited(QString) |
exampleWidget |
setShot(QString) |
Line Edit |
0 |
textEdited(QString) |
exampleWidget |
setRun(QString) |
Line Edit |
g2penkod |
textEdited(QString) |
exampleWidget |
setUser(QString) |
Line Edit |
viztest |
textEdited(QString) |
exampleWidget |
setDevice(QString) |
Push Button |
Open IDS |
clicked() |
exampleWidget |
openIDS() |
Push Button |
Plot flux loop |
clicked() |
exampleWidget |
openIDS() |
Push Button |
Plot poloidal field |
clicked() |
exampleWidget |
openIDS() |
exampleWidget |
Open IDS |
idsSet() |
Group Box (top) |
SetChecked(bool) |
The final list of necessary signal/slot links in Qt Designer for this case is shown in the figure below.
At this point, the plugin is completed.
3.1.3.3.3. Qt Designer Preview
The constructed plugin can be tested with the Qt Designer Preview option, found in the Form menu.
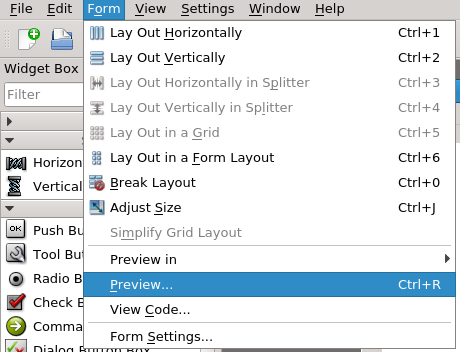
By pressing first the Open IDS button, waiting for a moment until the IDS data gets read, and then pressing the Plot flux loop button, the plot panel is populated as shown in the figure below.
Warning
This specified case is done for the GateWay HPC. Make sure, that the corresponding IDS exists and that it contains the right data!
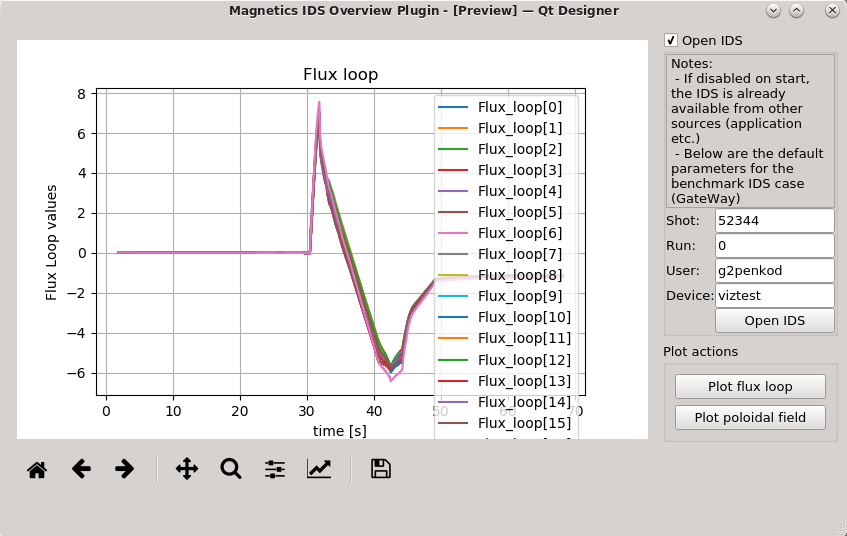
Plotting all Flux loop plots from the magnetics IDS with parameters (on GateWay HPC!) Shot: 52344, Run: 0, user: g2penkod, device: viztest.
3.1.3.3.4. Saving the Qt Designer form
The created Qt Designer GUI form (.ui extension) can be saved by navigating from menubar to File -> Save. The name can be set customly, in this case it is saved as examplePlugin.ui (do not confuse it with examplePlugin.py).
Warning
IMPORTANT: the .ui file must be saved in the same directory as the source files, in this case exampleWidget.py and examplePlugin.py.
3.1.3.3.5. Running the plugin .ui
The .ui plugin can be run using Python3 shell. Open Python3 shell and type the next commands:
from PyQt5.QtWidgets import QApplication
from PyQt5 import uic
app = QApplication([])
uiObj = uic.loadUi('SOLPSplugin.ui')
uiObj.show()
A script example run_plugin_ui_standalone.py is available in the plugin
directory. It is run with the following command:
python3 run_plugin_ui_standalone.py
3.1.3.4. Adding plugin to IMASViz
Warning
Before proceeding, make sure that you made the step 8. in Creating a custom application/plugin with Qt Designer. Setting the objectName of the custom widget to mainPluginWidget is mandatory!
The main idea for integration of plugin in IMASViz is to simplify the plugin usage and to add further functionalities to IMASViz. By running the plugin from IMASViz the IMASViz created IDS object is passed to the plugin, thus opening and setting the IDS is not necessary (required when running the plugin as a standalone application as shown in Running the plugin .ui).
To run the plugin from IMASViz it must be first added (registered) in IMASViz
$VIZ_HOME/imasviz/VizPlugins/VizPlugins.py source file. This is done through
the next few steps:
Add plugin to a list of registered plugins
The RegisteredPlugins dictionary contains major plugin properties. The relevant properties for examplePlugin are highlighted in the code block below, where:
example_UiPlugin is a dictionary key (dictionary within RegisteredPlugins dictionary).
Warning
Mandatory: in case the plugin is created with the help of Qt Designer and .ui file is created, the key must contain suffix _UiPlugin in order for IMASViz to recognize and use it correctly!
UiFile dictionary key, holding full .ui filename.
dir dictionary key, holding the path to the dictionary where the .ui filename (and other plugin sources) are located.
targetIDSroot dictionary key, holding target IDS label.
targetOccurrence dictionary key, holding target IDS occurrence integer.
RegisteredPlugins = {'equilibriumcharts':'viz_equi.equilibriumcharts',
                     'SOLPS_UiPlugin': {
                         'UiFile': 'SOLPSplugin.ui',
                         'dir': os.environ['VIZ_HOME'] +
                                '/imasviz/VizPlugins/viz_solps/',
                         'targetIDSroot' : 'edge_profiles',
                         'targetOccurrence' : 0},
                     'example_UiPlugin': {
                         'UiFile': 'examplePlugin.ui',
                         'dir': os.environ['VIZ_HOME'] +
                                '/imasviz/VizPlugins/viz_example/',
                         'targetIDSroot': 'magnetics',
                         'targetOccurrence': 0}
                     }
Add plugin configuration
Each plugin can have its own specific configuration. In the case of the examplePlugin there are no configurations required. Still, an empty configuration must be provided, as highlighted in the code block below.
RegisteredPluginsConfiguration = {'equilibriumcharts':[{
                                      'time_i': 31.880, \
                                      'time_e': 32.020, \
                                      'delta_t': 0.02, \
                                      'shot': 50642, \
                                      'run': 0, \
                                      'machine': 'west_equinox', \
                                      'user': 'imas_private'}],
                                  'SOLPS_UiPlugin':[{}],
                                  'example_UiPlugin':[{}]
                           }
Add necessary entries
The entries are mainly related to plugin identification and presentation in IMASViz in terms of label in pop-up menus. The required entries are highlighted in the code blocks below.
EntriesPerSubject = {'equilibriumcharts': {'equilibrium_overview': [0],
                                           'overview': [0]},
                     'ToFuPlugin':        {'interferometer_overview': [0, 1],
                                           'bolometer_overview': [2, 3],
                                           'soft_x_rays_overview': [4, 5]},
                     'SOLPS_UiPlugin':    {'edge_profiles_overview':[0],
                                           'overview':[0]},
                     'example_UiPlugin':  {'magnetics_overview': [0],
                                           'overview': [0]}
                     }
AllEntries = {'equilibriumcharts': [(0, 'Equilibrium overview...')],
              'ToFuPlugin':        [(0, 'tofu - geom...'), (1, 'tofu - data'),
                                    (2, 'tofu - geom...'), (3, 'tofu - data'),
                                    (4, 'tofu - geom...'), (5, 'tofu - data')],
              'SOLPS_UiPlugin':    [(0, 'SOLPS overview...')],
              'example_UiPlugin':  [(0, 'Magnetics overview...')]
              }
Now everything is ready to run the plugin from IMASViz.
3.1.3.5. Running the custom plugin in IMASViz
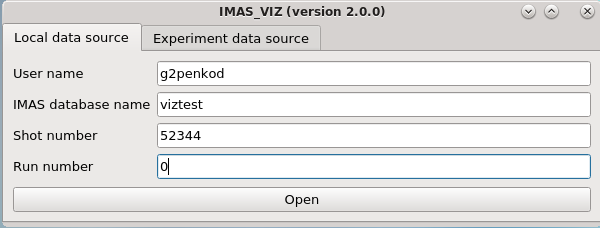
When running the IMASViz, for the means of this manual, open the IDS with the same case parameters as defined in Edit signals/slots.
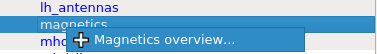
In the tree window, navigate to magnetics. While holding shift key right click on the magnetics label and in the popup menu select the Magnetics overview… option.
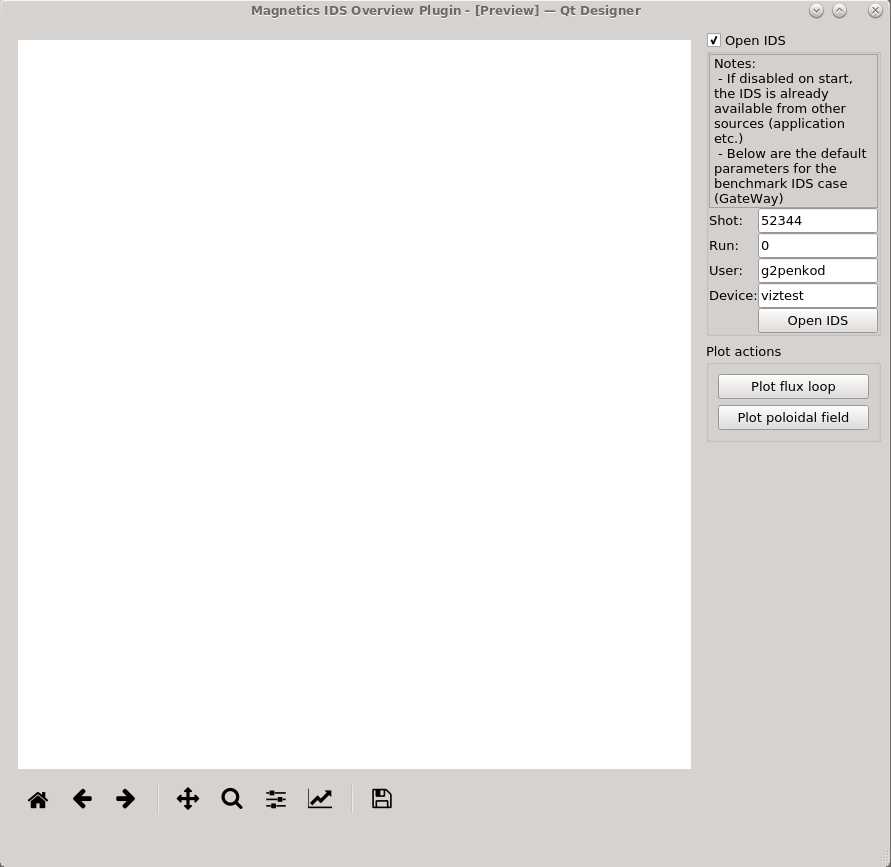
On selection confirm, the examplePlugin, now referred to as Magnetics IDS Overview Plugin, the plugin window is shown.
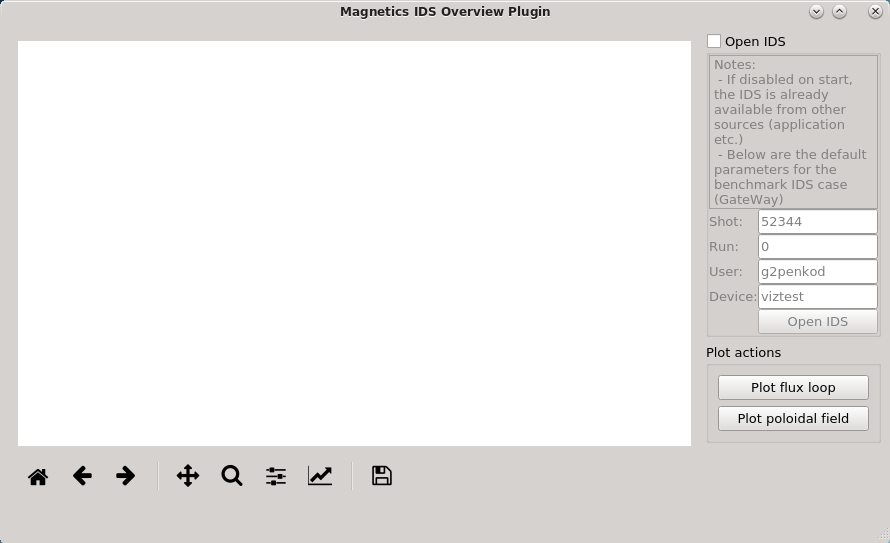
Magnetics IDS Overview Plugin on startup when run from within IMASViz.
It can be observed, that the top Group Box is disabled. This is due to our code and signal/slots, done in the plugin development phase in previous sections. This way if IDS object (now provided by IMASViz) is already provided on plugin startup the IDS set/open/read procedures are not required, but if needed are still functional and can be enabled with checking the checkbox. This way the plugin can be conveniently used as standalone or within other applications.
By pressing either Plot flux loop or Plot poloidal field buttons the corresponding data, specified in the plugin code development phase, are plotted.
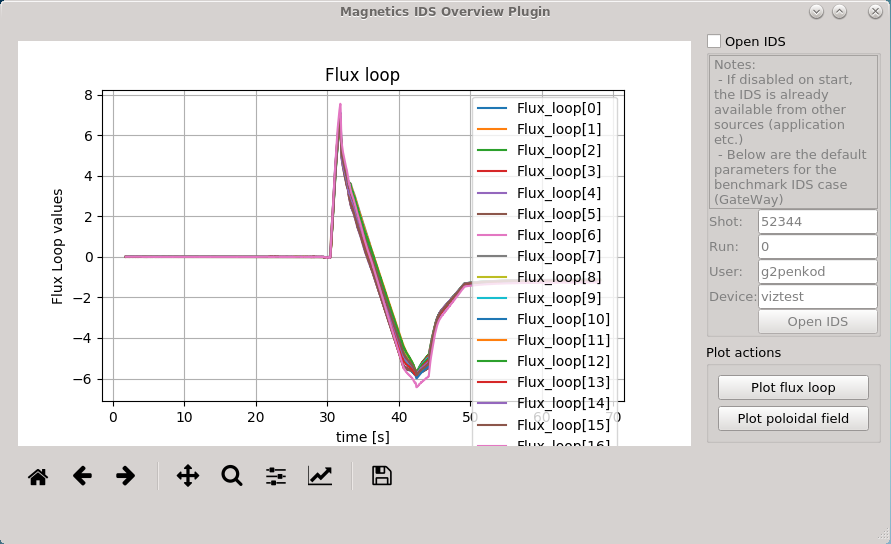
Magnetics IDS Overview Plugin with plotted all Flux loop data from the magnetics IDS (parameters (on GateWay HPC!) Shot: 52344, Run: 0, user: g2penkod, device: viztest.