2.5. Plugins
IMASViz allows the use of custom-made plugins which further extend the IMASViz functionality. The plugins currently available are listed here together with a manual section on how to use them.
2.5.1. Equilibrium overview plugin
This subsection describes and demonstrates the use of IMASViz equilibrium overview plugin, a simple utility for loading and displaying multiple data from equilibrium IDS at once.
2.5.1.1. Executing the equilibrium overview plugin
The procedure of executing the IMASViz Equilibrium overview plugin is as follows:
In opened IMAS database navigate to the equilibrium IDS.
While holding the shift keyboard button, right-click on the equilibirum node. In a pop up menu a list of available plugins for the equilibrium IDS will be displayed.
Click the Equilibrium overview option.
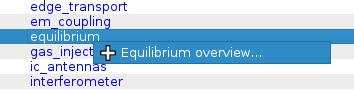
Equilibrium overview plugin popup menu option.
The plugin will then first grab the data from the Equilibrium IDS which takes a few seconds. After that the plugin window will appear.
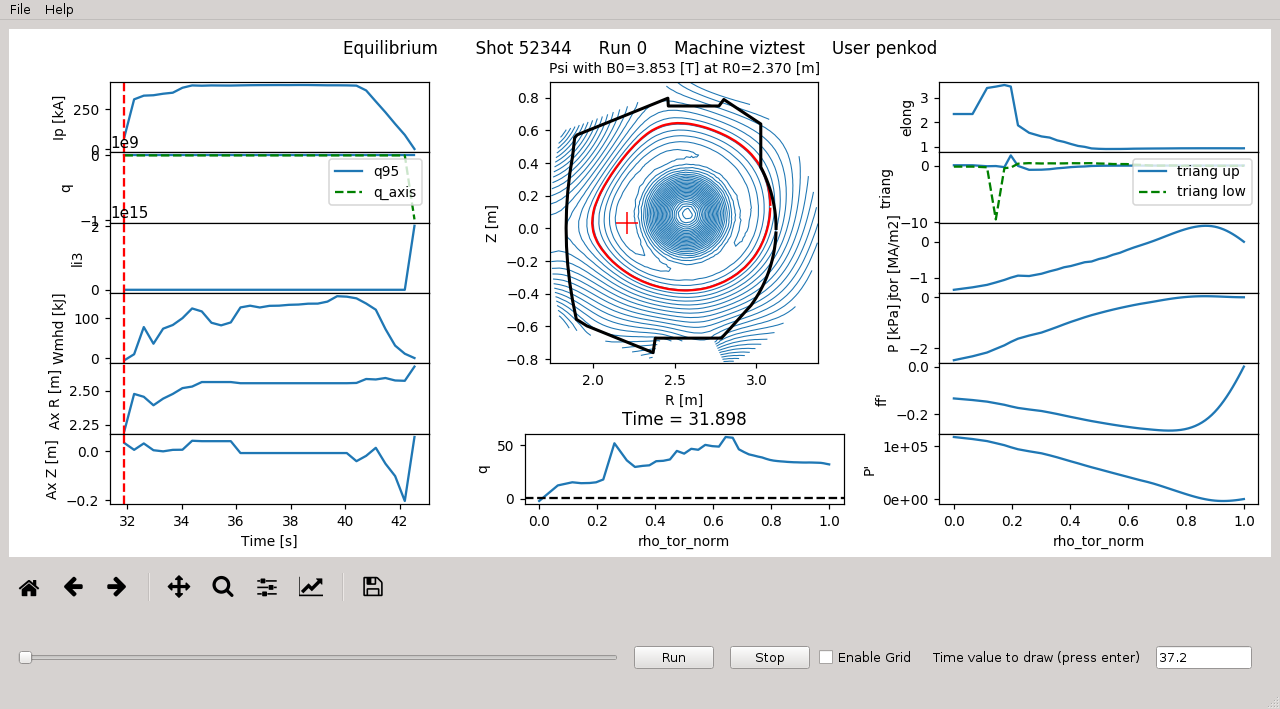
Equilibrium overview plugin main window.
2.5.1.2. Equilibrium overview plugin GUI features
The Equilibrium plugin allows some interaction with the plots that are described below.
2.5.1.2.1. Plot at time slice using slider
The plotting time value can be easily set by holding and moving the slider. By doing that the red dashed line on the left plot will move at the same time, indicating the selected time value (position).
On slider release all plots are updated for the selected time.
2.5.1.2.2. Plot at time slide using time value
The time can be specified directly by typing the value to the time value box.

Time value box.
By pressing enter keyboard button, all plots are be updated for the specified time.
Note
Check the left plot for the time values range.
2.5.1.2.3. Run through time slices
This feature allows the plugin to go through all time values and at the same time update all plots, giving a good overall overview.
This is done by pressing the Run button.
2.5.1.2.4. Enable plot grid
To enable grid on all plots check the Enable Grid option.
2.5.2. SOLPS overview plugin
This subsection describes and demonstrates the use of IMASViz SOLPS overview plugin, a simple utility for loading and displaying grid geometry (including grid subsets), and physics quantities (such as electron density, ion temperature etc.) stored within edge_profiles IDS GGD (General Grid Description).
Note
The SOLPS overview plugin can be run also in a standalone mode
(outside IMASViz) either from widget source code or from plugin .ui source.
The necessary sources can be found in directory
$VIZ_HOME/imasviz/VizPlugin/viz_solps. There, to run standalone widget
run command python3 SOLPSwidget.py in terminal. To run standalone plugin
(the same one as used in IMASViz) run command
python3 run_plugin_ui_standalone.py.
Note
The development procedure of the SOLPS overview plugin can be seen in a short movie found in section Developing a custom user interface (UI) plugins with Qt designer.
2.5.2.1. Executing the SOLPS overview plugin
The procedure of executing the IMASViz SOLPS overview plugin is as follows:
In opened IMAS database navigate to the edge_profiles IDS.
While holding the shift keyboard button, right-click on the edge_profiles node. In a pop up menu a list of available plugins for the edge_profiles IDS will be displayed.
Click the SOLPS overview option.
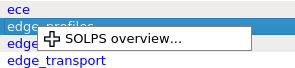
SOLPS overview plugin popup menu option
After that the main plugin window will appear, containing an empty plot widget and a few buttons.
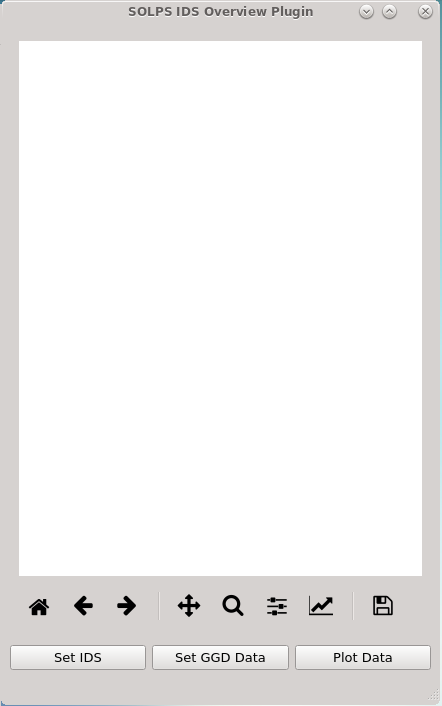
SOLPS overview plugin main window.
Click the Set IDS button. The plugin will then first read the available data from the Edge Profiles IDS (provided by IMASViz) and build the tree view which takes a few seconds.
Click the Set Data button. After that a dialog window will appear, requesting:
GGD Grid (Slice), specifying a grid geometry time slice. In most cases the grid geometry does not change with time so in such cases is obsolete to ‘re-write’ it (that is also the reason why the GGD Grid (grid_ggd) and GGD Quantities (ggd) structures are separated).
GGD Quantities (Slice), specifying the time slice for physics quantities,
Grid Subset, listing all available 2D grid subsets for specified GGD Grid and GGD Quantities slice.
Grid Subset Quantity, listing all available quantities for grid subset specified by Grid Subset drop down list.
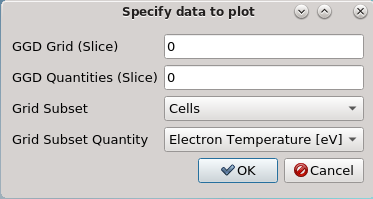
SOLPS overview plugin dialog for setting data (basic example values are set).
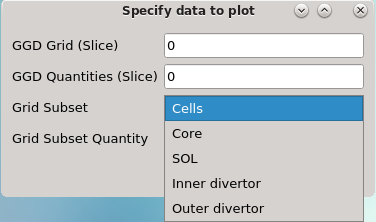
List of available (2D) grid subsets for current IDS.
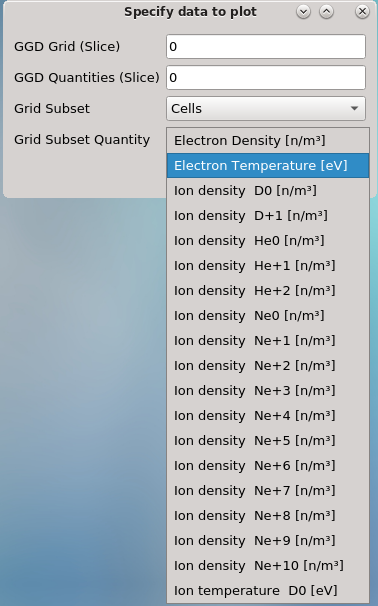
List of available physics quantities for current IDS.
After the requested parameters are set, press the OK button.
Click the Plot Data button. After pressing the button the plot widget will be populated with plot created using the specified data.
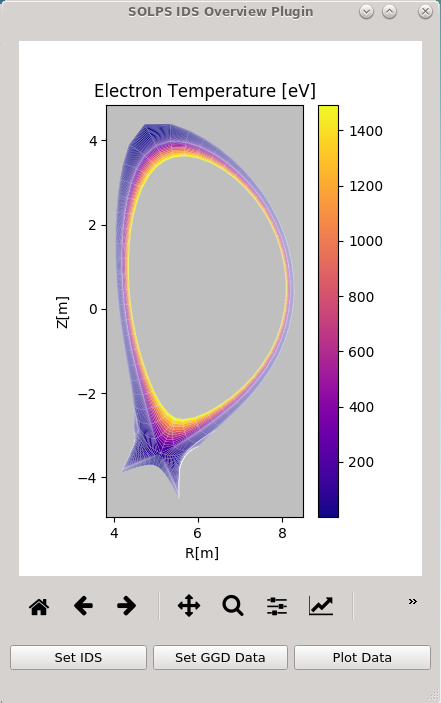
SOLPS overview plugin plot - Cells grid subset (all 2D quad elements in the domain) + electron temperature quantity values.