2.7. Scripting
There are two main methods to open and browse IMAS IDS database using IMASViz. First is the standard way of running IMASViz (as described in Getting Started) and setting the parameters in the GUI, the second is through a script. Furthermore, some GUI actions (like node selection, plot action commands etc.) can be performed through scripting too. This way a simple IMASViz session can be set and populated on run.
This section describes the second method: how to create and use user-made Python3 scripts that run and populate IMASViz.
IMASViz scripting can be seen as an advanced alternative to the Apply Configuration features (described in Apply Selection From Saved Configuration and Applying MultiPlot configuration to other IMAS database).
The procedure below can be used with either IMASViz module and IMASViz from source but the environment must be set accordingly to the method the IMASViz is used (!) (as described in Running IMASViz as a module and Running IMASViz from source).
2.7.1. Adding IMASViz Path to PYTHONPATH
Warning
Before proceeding, make sure that the environment is properly pre-set! This way also the VIZ_HOME system variable, required in this manual section, is available.
The IMASViz home directory can be added to PYTHONPATH system variable by running in the terminal the command below (use the command that matches your shell - c-shell or bash):
Note
PYTHONPATH is a “list” of paths that tell Python where to look for sources, libraries etc.
# c-shell (csh)
setenv PYTHONPATH ${VIZ_HOME}:${PYTHONPATH}
# bash
export PYTHONPATH=${VIZ_HOME}:${PYTHONPATH}
2.7.2. Creating A Script
This subsection will cover the basic procedure of writing a Python3 script that can be used with IMASViz. Few such working script examples are shown in section Script examples. The same examples can be found in project GIT repository here.
- First, the imports are required:
constants, functions, and methods of the Python interpreter,
PyQt5 classes and routines, and
IMASViz classes and routines.
# !/usr/bin/python
# A module providing a number of functions and variables that can be used to
# manipulate different parts of the Python runtime environment.
import sys
# PyQt library imports
from PyQt5.QtWidgets import QApplication
# IMASViz source imports
from imasviz.Viz_API import Viz_API
from imasviz.VizDataSource.QVizDataSourceFactory import QVizDataSourceFactory
from imasviz.VizUtils.QVizGlobalOperations import QVizGlobalOperations
from imasviz.VizGUI.VizGUICommands.VizMenusManagement.QVizSignalHandling \
    import QVizSignalHandlingds.VizMenusManagement.QVizSignalHandling \
        import QVizSignalHandling
Set object managing the PyQt GUI application’s control flow:
app = QApplication(sys.argv)
Check if necessary system variables are set
QVizGlobalOperations.checkEnvSettings()
Set Application Program Interface
api = Viz_API()
Set data source retriever/factory
dataSourceFactory = QVizDataSourceFactory()
Load IMAS database and build the data tree view
f1 = api.CreateDataTree(dataSourceFactory.create(shotNumber=52344,
                                         runNumber=0,
                                         userName='g2penkod',
                                         imasDbName='viztest'))
Add the build data tree view (DTV) to a list (!)
f = [f1]
Set the list of node paths
pathsList1 = []
for i in range(0, 5):
    pathsList1.append('magnetics/flux_loop(' + str(i) + ')/flux/data')
Select signals corresponding to the list of node paths
api.SelectSignals(f1, pathsList1)
Show the data tree window
f1.show()
Plot selected nodes
f = [f1]
api.PlotSelectedSignalsFrom(f)
Plot data from the first data source (f1) to Table Plot View
QVizSignalHandling(f1.dataTreeView).onPlotToTablePlotView(all_DTV=False)
Plot data from the first data source (f1) to Stacked Plot View
QVizSignalHandling(f1.dataTreeView).onPlotToStackedPlotView(all_DTV=False)
Keep the application running
sys.exit(app.exec_())
The final script is available below.
# !/usr/bin/python
# A module providing a number of functions and variables that can be used to
# manipulate different parts of the Python runtime environment.
import sys
# PyQt library imports
from PyQt5.QtWidgets import QApplication
# IMASViz source imports
from imasviz.Viz_API import Viz_API
from imasviz.VizDataSource.QVizDataSourceFactory import QVizDataSourceFactory
from imasviz.VizUtils.QVizGlobalOperations import QVizGlobalOperations
from imasviz.VizGUI.VizGUICommands.VizMenusManagement.QVizSignalHandling \
    import QVizSignalHandling

# Set object managing the PyQt GUI application's control flow and main
# settings
app = QApplication(sys.argv)

# Check if necessary system variables are set
QVizGlobalOperations.checkEnvSettings()

# Set Application Program Interface
api = Viz_API()

# Set data source retriever/factory
dataSourceFactory = QVizDataSourceFactory()

# Load IMAS database and build the data tree view
f1 = api.CreateDataTree(dataSourceFactory.create(shotNumber=52344,
                                                runNumber=0,
                                                userName='g2penkod',
                                                imasDbName='viztest'))

# Add data tree view frame to list (!)
f = [f1]

# Set the list of node paths that are to be selected
pathsList1 = []
for i in range(0, 5):
    pathsList1.append('magnetics/flux_loop(' + str(i) + ')/flux/data')

# Select signal nodes corresponding to the paths in pathsList
api.SelectSignals(f1, pathsList1)

# Show the data tree view window
f1.show()

# Plot signal nodes
# Note: Data tree view does not need to be shown in order for this
#       routine to work
api.PlotSelectedSignalsFrom(f)

# Plot data from the data source to Table Plot View
QVizSignalHandling(f1.dataTreeView).onPlotToTablePlotView(all_DTV=False)

# Plot data from the data source to Stacked Plot View
QVizSignalHandling(f1.dataTreeView).onPlotToStackedPlotView(all_DTV=False)

# Keep the application running
sys.exit(app.exec_())
2.7.3. Running the script
With the environment set (done in Adding IMASViz Path to PYTHONPATH) and script completed (done in Creating A Script), the script can be run using the basic Python3 terminal command:
python3 <path_to_script>/<script_name>.py
By running this script all Data Tree Views, Plot Widgets and MultiPlot Views, previously set in the script, should show, as shown in the figure below.
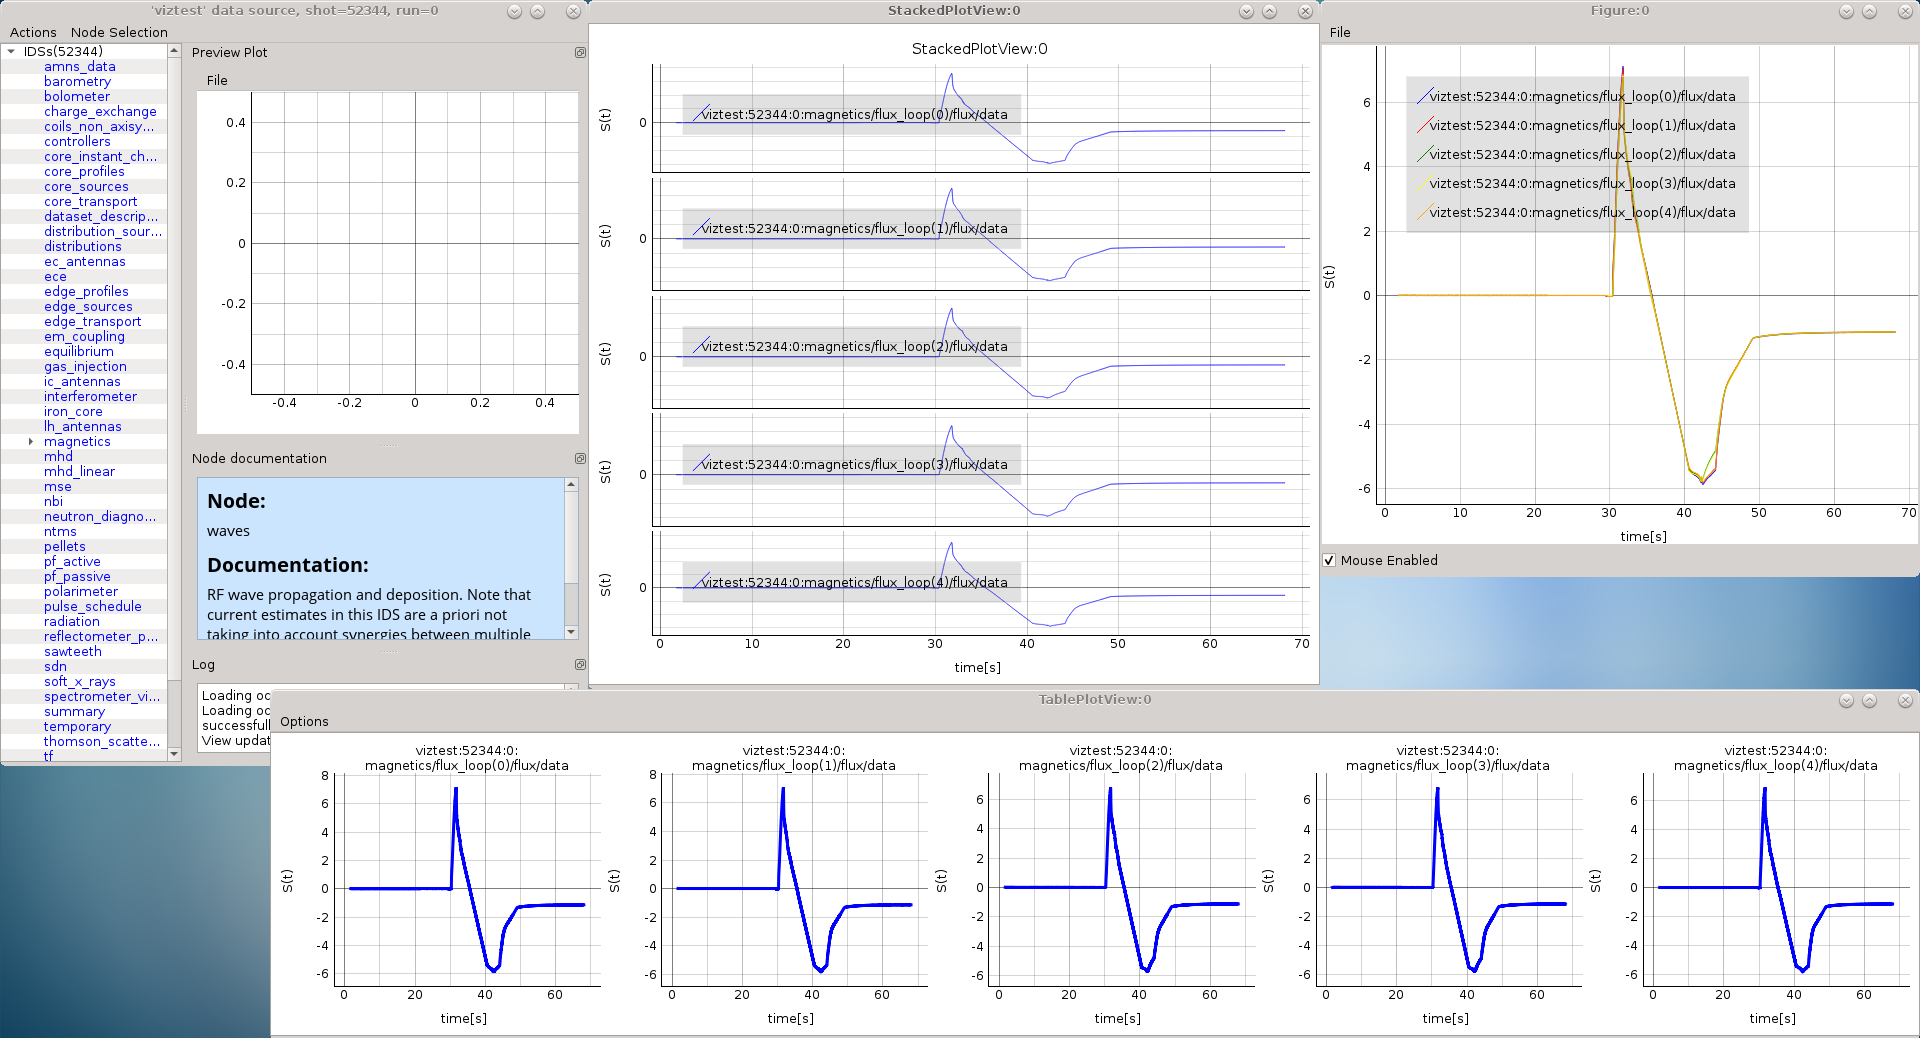
The result of running the script example: Data Tree View (DTV), Plot Widget, Table Plot View and Stacked Plot View containing multiple plots.
2.7.4. Script examples
Few complete script examples are shown below. The same examples can be found in project GIT repository here.
2.7.4.1. Example 1
1 2 3 4 5 6 7 8 9 10 11 12 13 14 15 16 17 18 19 20 21 22 23 24 25 26 27 28 29 30 31 32 33 34 35 36 37 38 39 40 41 42 43 44 45 46 47 48 49 50 51 52 53 54 55 56 57 58 59 60 61 62 63 64 65 66 67 68 69 70 71 72 73 74 75 76 77 78 79 80 81 82 83 84 85 | # Name : example1.py
#
# An example of IMASViz script demonstrating how to plot multiple
# signals (defined by paths) to a regular plot.
#
# Author :
# Ludovic Fleury, Xinyi Li, Dejan Penko
# E-mail :
# ludovic.fleury@cea.fr, xinyi.li@cea.fr, dejan.penko@lecad.fs.uni-lj.si
#
#****************************************************
# Copyright(c) 2016- L. Fleury,X. Li, D. Penko
#****************************************************
#!/usr/bin/python
"""This example demonstrates the procedure of plotting multiple arrays to
a single plot, Table Plot View and Stacked Plot View, using IMAS IDS databases
located on the GateWay HPC.
"""
# A module providing a number of functions and variables that can be used to
# manipulate different parts of the Python runtime environment.
import sys
# PyQt library imports
from PyQt5.QtWidgets import QApplication
# IMASViz source imports
from imasviz.VizUtils.QVizGlobalOperations import QVizGlobalOperations
from imasviz.Viz_API import Viz_API
from imasviz.VizDataSource.QVizDataSourceFactory import QVizDataSourceFactory
from imasviz.VizUtils.QVizGlobalValues import QVizGlobalValues
# Set object managing the PyQt GUI application's control flow and main
# settings
app = QApplication(sys.argv)
# Check if necessary system variables are set
QVizGlobalOperations.checkEnvSettings()
# Set Application Program Interface
api = Viz_API()
# Set data source retriever/factory
dataSourceFactory = QVizDataSourceFactory()
ok, shotNumber, runNumber, userName, tokamak = QVizGlobalOperations.askForShot()
if not ok:
print("User input has failed. Example1 not executed.")
else:
# Load IMAS database
dataSource = dataSourceFactory.create(
dataSourceName=QVizGlobalValues.IMAS_NATIVE,
shotNumber=shotNumber,
runNumber=runNumber,
userName=userName,
imasDbName=tokamak)
# Build the data tree view frame
f = api.CreateDataTree(dataSource)
# Set the list of node paths that are to be selected
paths = []
for i in range(0,6):
paths.append('magnetics/flux_loop(' + str(i) + ')/flux/data')
# Change it to dictionary with paths an occurrences (!)
pathsDict = {'paths' : paths,
'occurrences' : [0]}
# Optional: Option with single path in dictionary
# paths = {'paths' : 'magnetics/flux_loop(1)/flux/data'}
# or
# paths = {'paths' : ['magnetics/flux_loop(1)/flux/data']}
# Select signal nodes corresponding to the paths in paths list
api.SelectSignals(f, pathsDict)
# Plot signal nodes
# Note: Data tree view does not need to be shown in order for this routine to
# work
api.PlotSelectedSignals(f)
# Keep the application running
app.exec()
|
2.7.4.2. Example 2
1 2 3 4 5 6 7 8 9 10 11 12 13 14 15 16 17 18 19 20 21 22 23 24 25 26 27 28 29 30 31 32 33 34 35 36 37 38 39 40 41 42 43 44 45 46 47 48 49 50 51 52 53 54 55 56 57 58 59 60 61 62 63 64 65 66 67 68 69 70 71 72 73 74 75 76 77 78 79 80 81 82 83 84 85 86 87 88 89 90 91 92 93 94 95 96 97 98 99 100 101 102 103 104 | # Name : example2.py
#
# An example of IMASViz script demonstrating how to plot multiple
# signals (defined by paths) to a single plot, Table Plot View and
# Stacked Plot View.
#
# Author :
# Ludovic Fleury, Xinyi Li, Dejan Penko
# E-mail :
# ludovic.fleury@cea.fr, xinyi.li@cea.fr, dejan.penko@lecad.fs.uni-lj.si
#
#****************************************************
# Copyright(c) 2016- L. Fleury,X. Li, D. Penko
#****************************************************
# !/usr/bin/python
# A module providing a number of functions and variables that can be used to
# manipulate different parts of the Python runtime environment.
import sys
# PyQt library imports
from PyQt5.QtWidgets import QApplication
# IMASViz source imports
from imasviz.Viz_API import Viz_API
from imasviz.VizDataSource.QVizDataSourceFactory import QVizDataSourceFactory
from imasviz.VizUtils.QVizGlobalOperations import QVizGlobalOperations
from imasviz.VizGUI.VizGUICommands.VizMenusManagement.QVizSignalHandling \
import QVizSignalHandling
# Set object managing the PyQt GUI application's control flow and main
# settings
app = QApplication(sys.argv)
# Check if necessary system variables are set
QVizGlobalOperations.checkEnvSettings()
# Set Application Program Interface
api = Viz_API()
# Set data source retriever/factory
dataSourceFactory = QVizDataSourceFactory()
ok, shotNumber, runNumber, userName, tokamak = QVizGlobalOperations.askForShot()
if not ok:
print("User input has failed on first shot. Example2 not executed.")
else:
f1 = api.CreateDataTree(dataSourceFactory.create(shotNumber=shotNumber,
runNumber=runNumber,
userName=userName,
imasDbName=tokamak))
ok, shotNumber, runNumber, userName, tokamak = QVizGlobalOperations.askForShot()
if not ok:
print("User input has failed on second shot. Example2 not executed.")
else:
f2 = api.CreateDataTree(dataSourceFactory.create(shotNumber=shotNumber,
runNumber=runNumber,
userName=userName,
imasDbName=tokamak))
# Add data tree view frames to list (!)
f = [f1, f2]
# Set the list of node paths that are to be selected
pathsList1 = []
for i in range(0, 5):
pathsList1.append('magnetics/flux_loop(' + str(i) + ')/flux/data')
pathsList2 = []
for i in range(0, 6):
pathsList2.append('magnetics/bpol_probe(' + str(i) + ')/field/data')
# Define the dictionary holding the list of paths and occurrence value
pathsDict1 = {'paths' : pathsList1,
'occurrences' : [0]}
pathsDict2 = {'paths' : pathsList2,
'occurrences' : [0]}
# Select signal nodes corresponding to the paths in paths list
api.SelectSignals(f1, pathsDict1)
api.SelectSignals(f2, pathsDict2)
# Show the data tree view window
f1.show()
f2.show()
# Plot signal nodes
# Note: Data tree view does not need to be shown in order for this routine to
# work
api.PlotSelectedSignalsFrom(f)
# Plot data from the first data source (f1) to Table Plot View
QVizSignalHandling(f1.dataTreeView).onPlotToTablePlotView(all_DTV=False)
# Plot data from the first data source (f1) to Stacked Plot View
QVizSignalHandling(f1.dataTreeView).onPlotToStackedPlotView(all_DTV=False)
# Keep the application running
sys.exit(app.exec_())
|
2.7.4.3. Example 2b
1 2 3 4 5 6 7 8 9 10 11 12 13 14 15 16 17 18 19 20 21 22 23 24 25 26 27 28 29 30 31 32 33 34 35 36 37 38 39 40 41 42 43 44 45 46 47 48 49 50 51 52 53 54 55 56 57 58 59 60 61 62 63 64 65 66 67 68 69 70 71 72 73 74 75 76 77 78 79 80 81 82 83 84 85 86 87 88 89 90 91 92 93 94 95 96 97 98 99 100 101 102 103 104 105 106 107 | # Name : example2b.py
#
# An example of IMASViz script demonstrating how to plot multiple
# signals (defined by paths) from two different IMAS IDS databases.
#
# Author :
# Ludovic Fleury, Xinyi Li, Dejan Penko
# E-mail :
# ludovic.fleury@cea.fr, xinyi.li@cea.fr, dejan.penko@lecad.fs.uni-lj.si
#
#****************************************************
# Copyright(c) 2016- L. Fleury,X. Li, D. Penko
#****************************************************
#!/usr/bin/python
# A module providing a number of functions and variables that can be used to
# manipulate different parts of the Python runtime environment.
import sys
# PyQt library imports
from PyQt5.QtWidgets import QApplication
# IMASViz source imports
from imasviz.Viz_API import Viz_API
from imasviz.VizDataSource.QVizDataSourceFactory import QVizDataSourceFactory
from imasviz.VizUtils.QVizGlobalValues import QVizGlobalValues
from imasviz.VizUtils.QVizGlobalOperations import QVizGlobalOperations
# Set object managing the PyQt GUI application's control flow and main
# settings
app = QApplication(sys.argv)
# Check if necessary system variables are set
QVizGlobalOperations.checkEnvSettings()
# Set Application Program Interface
api = Viz_API()
# Set data source retriever/factory
dataSourceFactory = QVizDataSourceFactory()
# Set and empty list for listing data tree view frames
f = []
# Set list of shots
#n_shot = [52702, 52703]
ok, shotNumber, runNumber, userName, tokamak = QVizGlobalOperations.askForShot()
if not ok:
print("User input has failed on first shot. Example2b not executed.")
else:
# Set first data source
dataSource1 = dataSourceFactory.create(dataSourceName=QVizGlobalValues.IMAS_NATIVE,
shotNumber=shotNumber,
runNumber=runNumber,
userName=userName,
imasDbName=tokamak)
# Append data tree view frame to list
f.append(api.CreateDataTree(dataSource1))
# set second data source
dataSource2 = dataSourceFactory.create(dataSourceName=QVizGlobalValues.IMAS_NATIVE,
shotNumber=shotNumber,
runNumber=runNumber,
userName=userName,
imasDbName=tokamak)
# Append data tree view frame to list
f.append(api.CreateDataTree(dataSource2))
ok, shotNumber, runNumber, userName, tokamak = QVizGlobalOperations.askForShot()
if not ok:
print("User input has failed on second shot. Example2b not executed.")
else:
# Set the list of node paths (for both databases) that are to be selected
pathsList1 = []
for i in range(0, 3):
pathsList1.append('magnetics/flux_loop(' + str(i) + ')/flux/data')
pathsList2 = []
for i in range(0, 3):
pathsList2.append('magnetics/bpol_probe(' + str(i) + ')/field/data')
# Define the dictionary holding the list of paths and occurrence value
pathsDict1 = {'paths' : pathsList1,
'occurrences' : [0]}
pathsDict2 = {'paths' : pathsList2,
'occurrences' : [0]}
# Select signal nodes corresponding to the paths in paths list
api.SelectSignals(f[0], pathsDict1)
api.SelectSignals(f[1], pathsDict2)
# Plot signals (e.g. data from nodes)
# Note: Data tree view does not need to be shown in order for this
# routine to work
api.PlotSelectedSignalsFrom([f[0]]) # Plot signals from first source to
# first figure
api.PlotSelectedSignalsFrom([f[1]]) # Plot signals from first source to
# second figure
api.PlotSelectedSignalsFrom(f) # Plots selected signals from both sources
# to the same figure
# Show the data tree view window
f[0].show()
f[1].show()
# Keep the application running
app.exec()
|
2.7.4.4. Example 3
1 2 3 4 5 6 7 8 9 10 11 12 13 14 15 16 17 18 19 20 21 22 23 24 25 26 27 28 29 30 31 32 33 34 35 36 37 38 39 40 41 42 43 44 45 46 47 48 49 50 51 52 53 54 55 56 57 58 59 60 61 62 63 64 65 66 67 68 69 70 71 72 73 74 75 | # Name : example3.py
#
# An example of IMASViz script demonstrating how to plot multiple
# signals (defined by paths) to a single TablePlotView.
#
# Author :
# Ludovic Fleury, Xinyi Li, Dejan Penko
# E-mail :
# ludovic.fleury@cea.fr, xinyi.li@cea.fr, dejan.penko@lecad.fs.uni-lj.si
#
#****************************************************
# Copyright(c) 2016- L. Fleury,X. Li, D. Penko
#****************************************************
#!/usr/bin/python
# A module providing a number of functions and variables that can be used to
# manipulate different parts of the Python runtime environment.
import sys
# PyQt library imports
from PyQt5.QtWidgets import QApplication
# IMASViz source imports
from imasviz.VizUtils.QVizGlobalOperations import QVizGlobalOperations
from imasviz.Viz_API import Viz_API
from imasviz.VizDataSource.QVizDataSourceFactory import QVizDataSourceFactory
from imasviz.VizUtils.QVizGlobalValues import QVizGlobalValues
# Set object managing the PyQt GUI application's control flow and main
# settings
app = QApplication(sys.argv)
# Check if necessary system variables are set
QVizGlobalOperations.checkEnvSettings()
# Set Application Program Interface
api = Viz_API()
# Set data source retriever/factory
dataSourceFactory = QVizDataSourceFactory()
ok, shotNumber, runNumber, userName, tokamak = QVizGlobalOperations.askForShot()
if not ok:
print("User input has failed. Example3 not executed.")
else:
# Load IMAS database
dataSource = dataSourceFactory.create(dataSourceName=QVizGlobalValues.IMAS_NATIVE,
shotNumber=shotNumber,
runNumber=runNumber,
userName=userName,
imasDbName=tokamak)
# Build the data tree view frame
f = api.CreateDataTree(dataSource)
# Set the list of node paths that are to be selected
pathsList = []
for i in range(0, 5):
pathsList.append('magnetics/flux_loop(' + str(i) + ')/flux/data')
# Define the dictionary holding the list of paths and occurrence value
pathsDict = {'paths' : pathsList,
'occurrences' : [0]}
# Select signal nodes corresponding to the paths in paths list
api.SelectSignals(f, pathsDict)
# Plot the set of signal nodes selected by the user to a new Table Plot View.
api.PlotSelectedSignalsInTablePlotViewFrame(f)
# Show the data tree view window
api.ShowDataTree(f)
# Keep the application running
app.exec()
|
2.7.4.5. Example 4
1 2 3 4 5 6 7 8 9 10 11 12 13 14 15 16 17 18 19 20 21 22 23 24 25 26 27 28 29 30 31 32 33 34 35 36 37 38 39 40 41 42 43 44 45 46 47 48 49 50 51 52 53 54 55 56 57 58 59 60 61 62 63 64 65 66 67 68 69 70 71 72 73 74 75 76 77 78 79 80 81 82 83 84 85 86 87 88 89 90 91 92 93 94 95 96 97 98 | # Name : example4.py
#
# An example of IMASViz script demonstrating how to select signals
# from the selected configuration file and plots it to the TablePlot.
#
# Author :
# Ludovic Fleury, Xinyi Li, Dejan Penko
# E-mail :
# ludovic.fleury@cea.fr, xinyi.li@cea.fr, dejan.penko@lecad.fs.uni-lj.si
#
#****************************************************
# Copyright(c) 2016- L. Fleury,X. Li, D. Penko
#****************************************************
#!/usr/bin/python
import os
# A module providing a number of functions and variables that can be used to
# manipulate different parts of the Python runtime environment.
import sys
# PyQt library imports
from PyQt5.QtWidgets import QApplication
# IMASViz source imports
from imasviz.VizUtils.QVizGlobalOperations import QVizGlobalOperations
from imasviz.Viz_API import Viz_API
from imasviz.VizDataSource.QVizDataSourceFactory import QVizDataSourceFactory
from imasviz.VizGUI.VizGUICommands.VizDataSelection.QVizSelectSignals import QVizSelectSignals
from imasviz.VizGUI.VizGUICommands.VizDataSelection.QVizUnselectAllSignals import QVizUnselectAllSignals
from imasviz.VizUtils.QVizGlobalValues import QVizGlobalValues
from PyQt5.QtWidgets import QFileDialog
# Set object managing the PyQt GUI application's control flow and main
# settings
app = QApplication(sys.argv)
# Check if necessary system variables are set
QVizGlobalOperations.checkEnvSettings()
# Set Application Program Interface
api = Viz_API()
# Set data source retriever/factory
dataSourceFactory = QVizDataSourceFactory()
# Set user (get current user)
userName = os.environ['USER']
ok, shotNumber, runNumber, userName, tokamak = QVizGlobalOperations.askForShot()
if not ok:
print("User input has failed. Example3 not executed.")
else:
# Load IMAS database
dataSource = dataSourceFactory.create(
dataSourceName=QVizGlobalValues.IMAS_NATIVE,
shotNumber=shotNumber,
runNumber=runNumber,
userName=userName,
imasDbName=tokamak)
# Build the data tree view frame
f = api.CreateDataTree(dataSource)
# Set configuration file using file dialog
# Note: configuration files are located in $HOME/.imasviz by default
options = QFileDialog.Options()
options |= QFileDialog.DontUseNativeDialog
configFilePath, ok = QFileDialog.getOpenFileName(None,
"Select plot config. file",
os.environ["HOME"]+"/.imasviz/",
"LSP Files (*.lsp*)",
options=options)
if not ok:
print("User input has failed. Example4 not executed.")
else:
# Extract signal paths from the config file and add them to a list of
# paths
pathsMap = QVizGlobalOperations.getSignalsPathsFromConfigurationFile(
configFile=configFilePath)
# First unselect all signals (optional)
# QVizUnselectAllSignals(dataTreeView=f.dataTreeView).execute()
# Select the signals, defined by a path in a list of paths, in the
# given Data Tree View (DTV) window
QVizSelectSignals(dataTreeView=f.dataTreeView,
pathsMap=pathsMap).execute()
# Plot the set of the signal nodes selected using plot configuration file to
# a new Table Plot View and apply plot configurations (colors, line width etc.)
api.PlotSelectedSignalsInTablePlotViewFrame(f)
# Show the DTV window
# f.show()
# Keep the application running
app.exec()
|